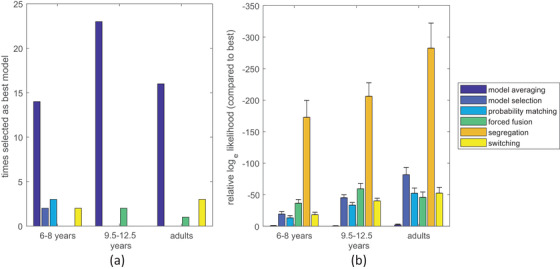
FIGURE 5.

Model comparison results. (a) The number of participants for which a particular model gave the best fit. (b) The average difference in log likelihood between each model and the best fitting model for each participant (error bars indicate standard errors)
