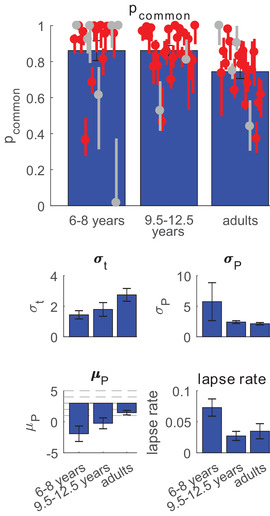
FIGURE 6.

Estimates of parameter values for the model averaging model. For pcommon , individual MAP estimates and 95% credible intervals are shown. Red data points correspond to participants for whom model averaging outperformed the other models, grey points correspond to participants for whom one of the other models was best. Bar plots show the mean MAP estimates for all parameters. For μ p the dotted lines correspond to the five node locations; μ P = 3 corresponds to a prior centered at the middle node. pcommon : prior on common cause; σ t : standard deviation of tactile noise; σ P , μ P : standard deviation and center of Gaussian location prior; lapse rate: proportion of trials in which a random response is given
