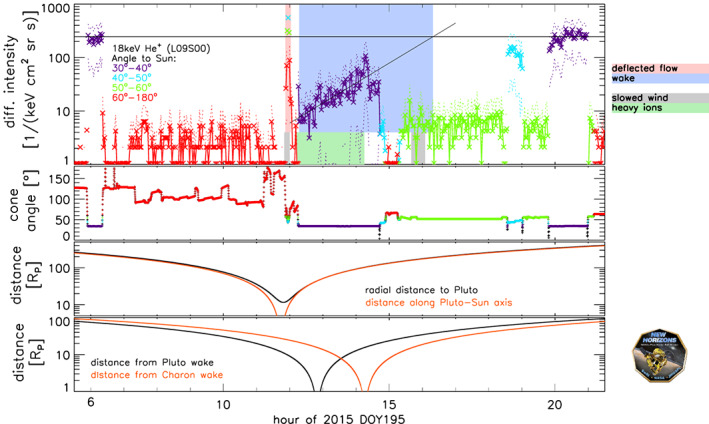
Figure 1.

Overview of interstellar pickup and suprathermal ion measurements around Pluto. We only show data from a single sector of the Pluto Energetic Particle Spectrometer Science Investigation (PEPSSI) for clarity. This sector points into different look directions as a function of time, depending on the changing spacecraft attitude. (first panel) The x symbols and colored solid lines show intensities dominated by 18‐keV He+ ions. The color coding marks measurements at different cone angles relative to the Sun. Dashed lines indicate the Poisson error envelope of the intensities. Black lines show the average IPS intensity in the solar wind and an extrapolation of the Pluto wake intensity. The crossing point is an estimate when New Horizons passed the magnetic boundary of the Pluto wake. Blue and red shaded areas call out two regions discussed in section 3.1 and 3.2. Gray and green shading provide context, showing regions observed at lower energies than discussed in this paper (McComas et al., 2016). (second panel) Cone angle of the measurement shown in the first panel. (third panel) x PSH coordinate (orange) of New Horizons and the radial distance r to Pluto (black). (fourth panel) Cylindrical distance ρ of New Horizons to the wake center axis of Pluto (black) and of Charon (orange). PSH = Pluto Solar Heliographic coordinate system; DOY = day of year.
