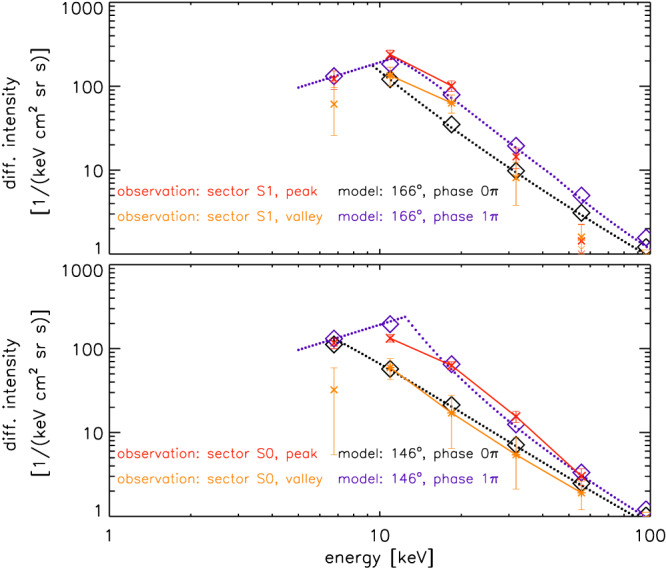
Figure 4.

Energy spectra measured at a peak within Pluto's energetic particle wake (red x symbols) and in a valley (orange x symbols) for two different ion velocity directions (two panels). The ion velocity direction is opposite to the instrument look direction, meaning that an ion direction of 146° and a look direction of 34° are labeling the same spacecraft attitude. Either number labels measurements by sector S0 (lower panel), which is measuring further from the Sun than the other used sector, S1 (upper panel). We only connect data points with lines that are reliable in the sense that the Poisson error bars are small and where the bars of peak and valley do not overlap. Blue and black dotted curves: Model spectra assuming a time‐varying electric field (section 4.2). Blue and black diamonds = averages of the model spectra over the energy range that is also used for the measurements.
