FIGURE 2.

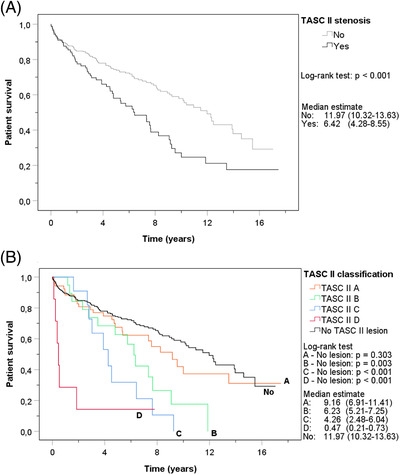
Kaplan‐Meier curves of cumulative patient survival with all‐cause mortality as event. (A). Patient survival for stenosis and no stenosis. (B). Patient survival for different TASC II lesions and no stenosis

Kaplan‐Meier curves of cumulative patient survival with all‐cause mortality as event. (A). Patient survival for stenosis and no stenosis. (B). Patient survival for different TASC II lesions and no stenosis