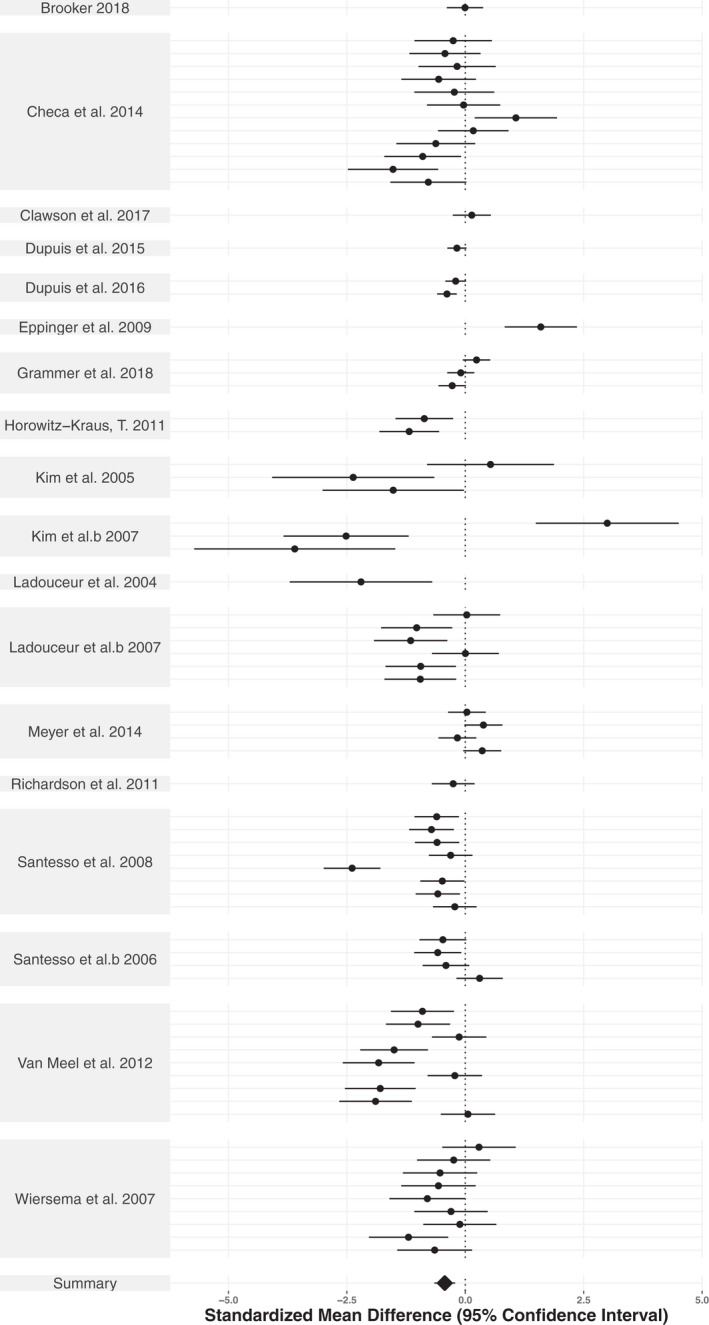
FIGURE 4.

Forest plot illustrating the age‐group effect sizes for the ERN. Standardized mean difference(s) per study is represented by the black dots. The summary standardized mean difference from the three‐level meta‐analytic model is represented as a black diamond. The 95% confidence interval is represented as horizontal lines
