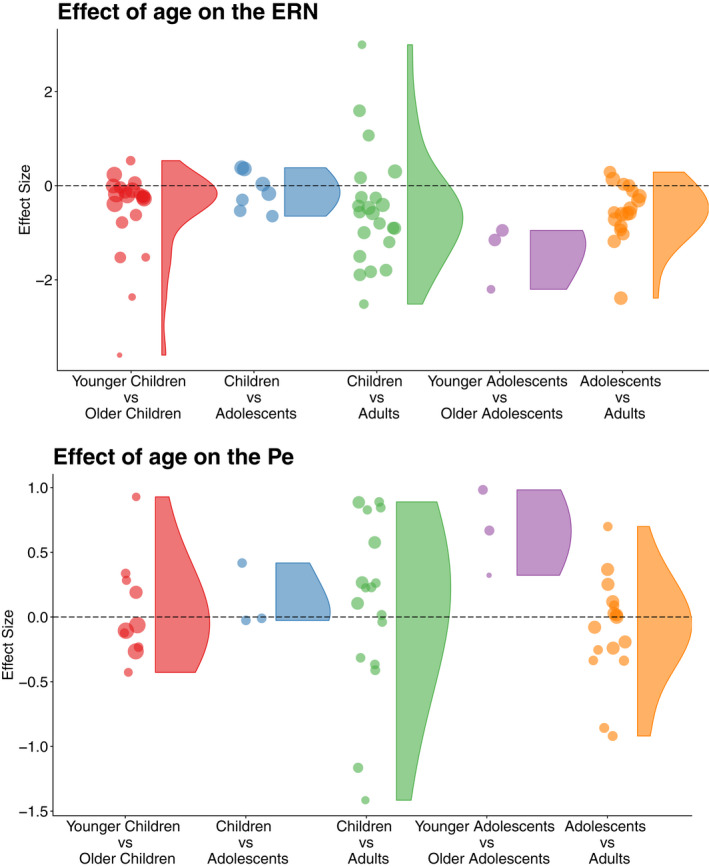
FIGURE 6.

Violin plot of the effect sizes across age groups for the ERN (top) and the Pe (bottom). The dots represent individual effect sizes and the size represents the variation (i.e., larger dots indicate less variation). Age ranges, ERN: Younger Children (3.6–8.1) versus Older Children (4.6–11.0), Children (7.9–11.0) versus Adolescence (12.7–13.4), Children (5.1–11.4) versus Adults (20.8–26.5), Younger Adolescents (12.2–12.4) versus Older Adolescents (15.8–16.5), Adolescence (12.4–16.5) versus Adults (18.5–28.7). Pe: Younger Children (5.1–8.1) versus Older Children (6.3–11.0), Children (7.9) versus Adolescents (13.4), Children (5.1–11.4) versus Adults (20.8–26.5), Younger Adolescents (12.2–12.4) versus Older Adolescents (15.8–16.5), Adolescence (12.4–16.5) versus Adults (18.5–28.7). The age ranges are based on the mean age from the age group that was derived from each of the included studies
