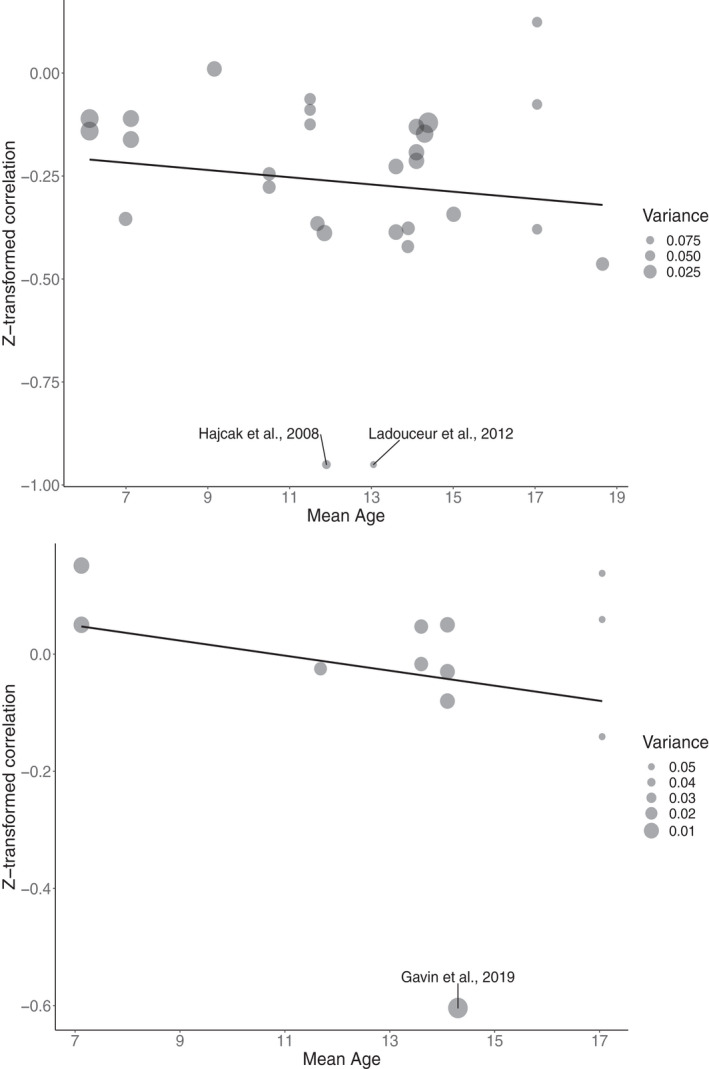
FIGURE 7.

Bubble plot illustrating the Z‐transformed correlations between mean age and ERN (top) and the Pe (bottom). Larger dots indicate less variation. Effect sizes that exceed 2.5 standard deviations from the mean are labeled with the study name. Regression line is included for visualization purposes only as it was estimated using linear regression that does not account for dependency in the data. Mean age range: 6.1–18.7
