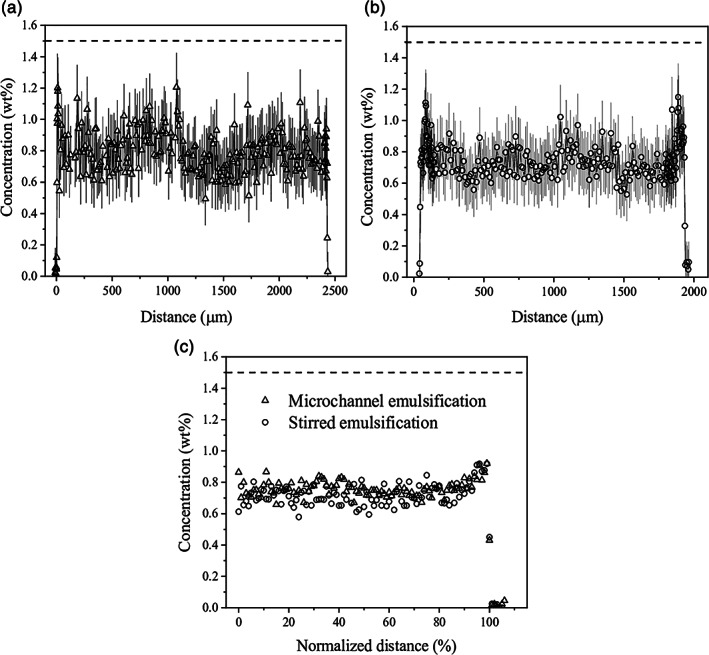
Figure 5.

Concentration profiles for alginate beads determined by confocal Raman microscopy imaging for (a) microchannel emulsification beads and (b) stirred emulsification beads. (c) Combined alginate concentration profiles made of averaged profiles for five microchannel emulsification beads and four stirred emulsification beads. In order to directly compare beads of different sizes, the profiles are plotted against the normalized distance that is calculated as M/R×100, where R is radius and M is distance within R, providing 0% in the centre and 100% at the bead surface, respectively. Dashed lines represent the initial concentration of alginate in solution equal to 1.5%
