Figure 7.

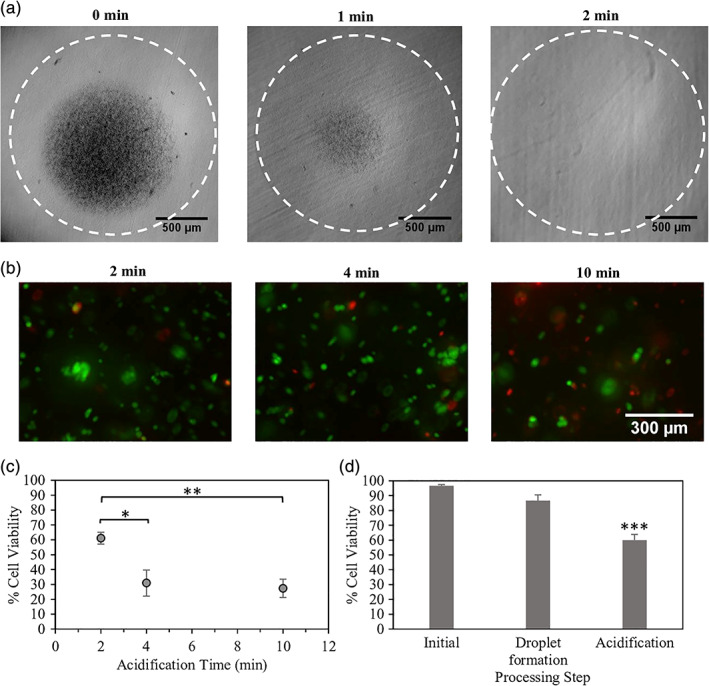
Effect of processing steps on beta cell survival. (a) Observed CaCO3 particle dissolution at different acidification times. (b) MIN6 cell survival at different acidification times visualized by calcein AM (live/green) and ethidium homodimer (dead/red) staining. (c,d) MIN6 cell survival quantified by flow cytometry at various (c) acidification times and (d) microchannel emulsification processing steps (initial, droplet formation before acid exposure, and acidification/internal gelation). *p < .05; **p < .01; ***p < .001
