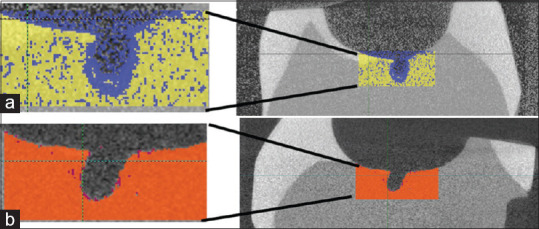
Figure 5.

(a) Adhesive control sample showing demineralization in blue at the defect location. Here yellow represents the prestudy scan data and blue represents the post-study scan data. This particular sample had a mean volume loss of 2.12 mm3. (b) Experimental adhesive with 5 mg/ml copper iodide particles. Here, orange represents the prestudy scan data and dark red represents post-study scan data. Notice almost no red color is visible with data showing a mass loss of only 0.05 mm3
