
Figure 5.
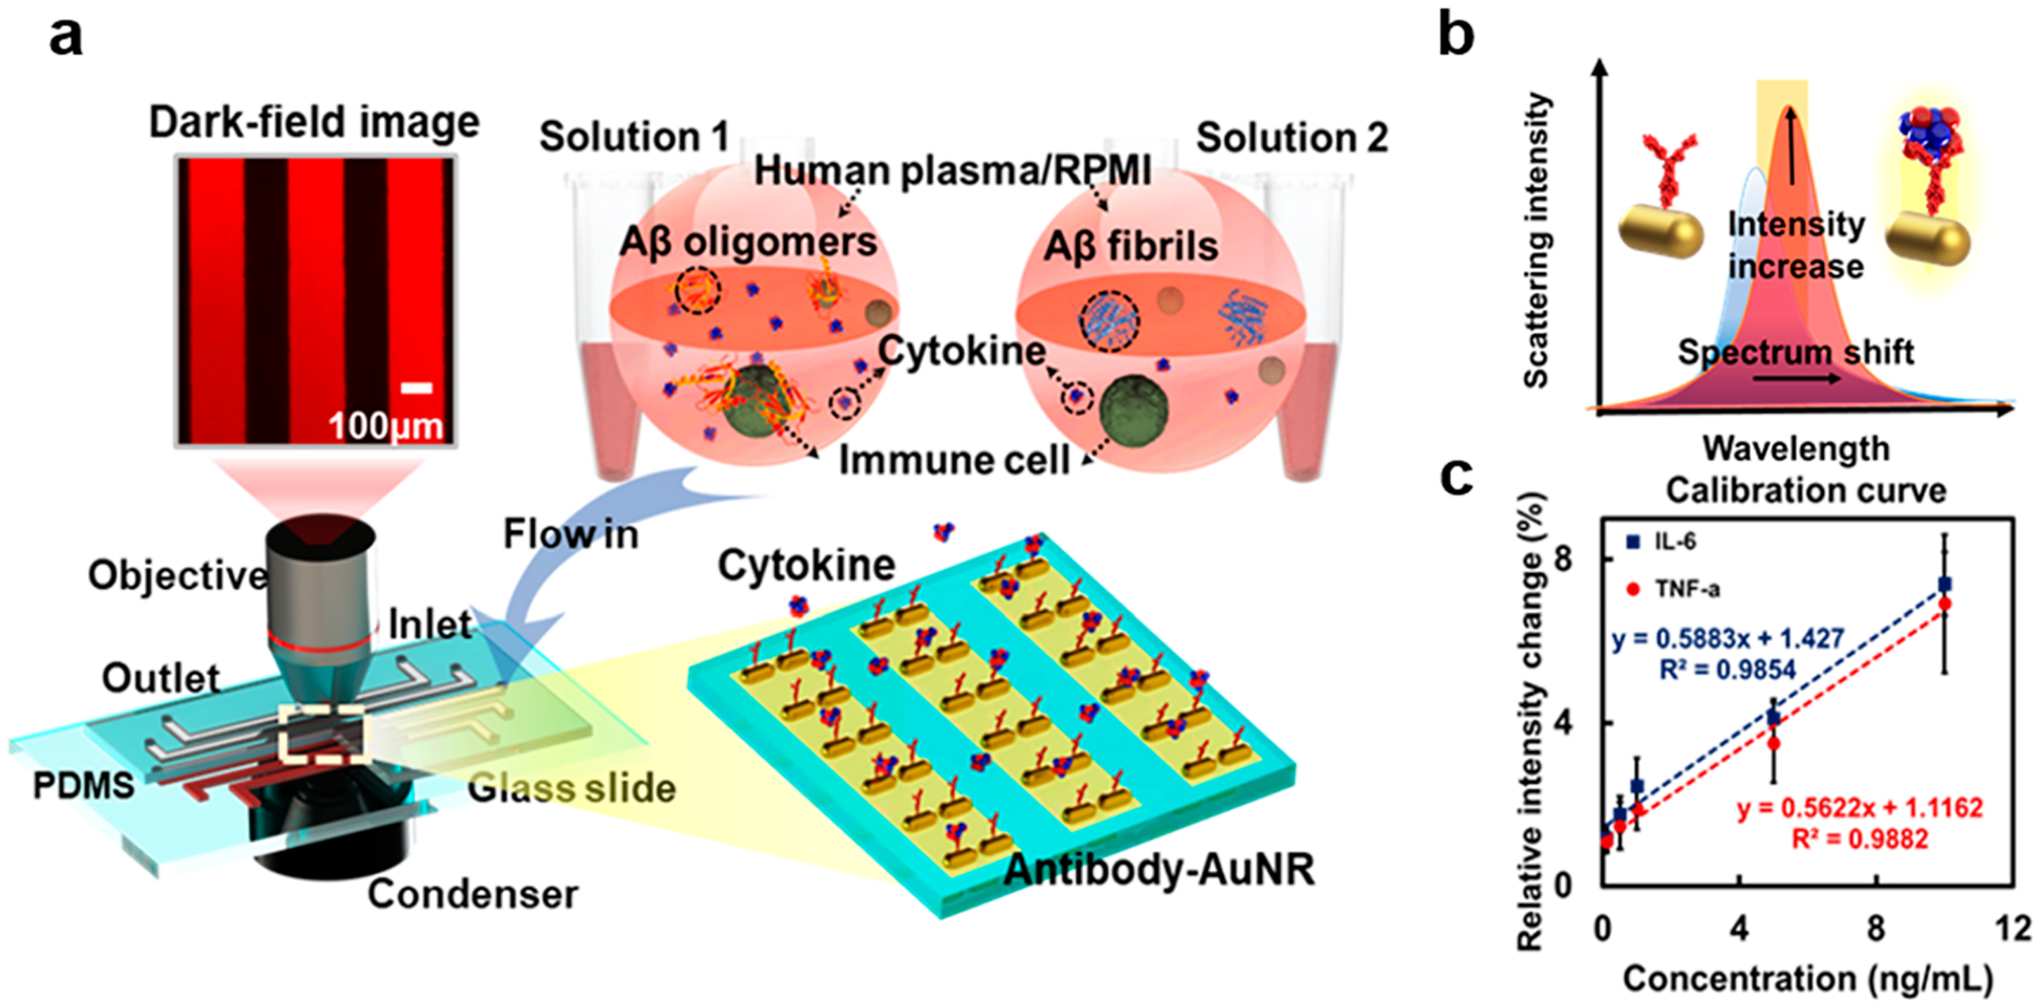
Schematics of the LSPR immunoassay. (a) LSPR immunoassay on Aβo- and Aβf-induced immune responses. Human immune cells (T cells, B cells, or THP-1 cells) were incubated with Aβo and Aβf in human plasma or RPIM medium, respectively. The cellular responses were compared by detecting secreted concentrations of TNF and IL-6 in the medium using LSPR microfluidic chips in dark field. (b) Cytokine binding with AuNR–antibody conjugates altered the local refractive index and scattering cross section of the nanostructure, giving rise to a red shift in the SRP peak coupled with an elevated scattering intensity. The cytokines secreted were determined by changes to the scattering light intensity using an EMCCD. (c) Calibrations of cytokines TNF and IL-6 showing the relative intensity changes of the LSPR barcode with varied cytokine concentrations. The trendline equations and R2 values are indicated. AuNR: gold nanorod.