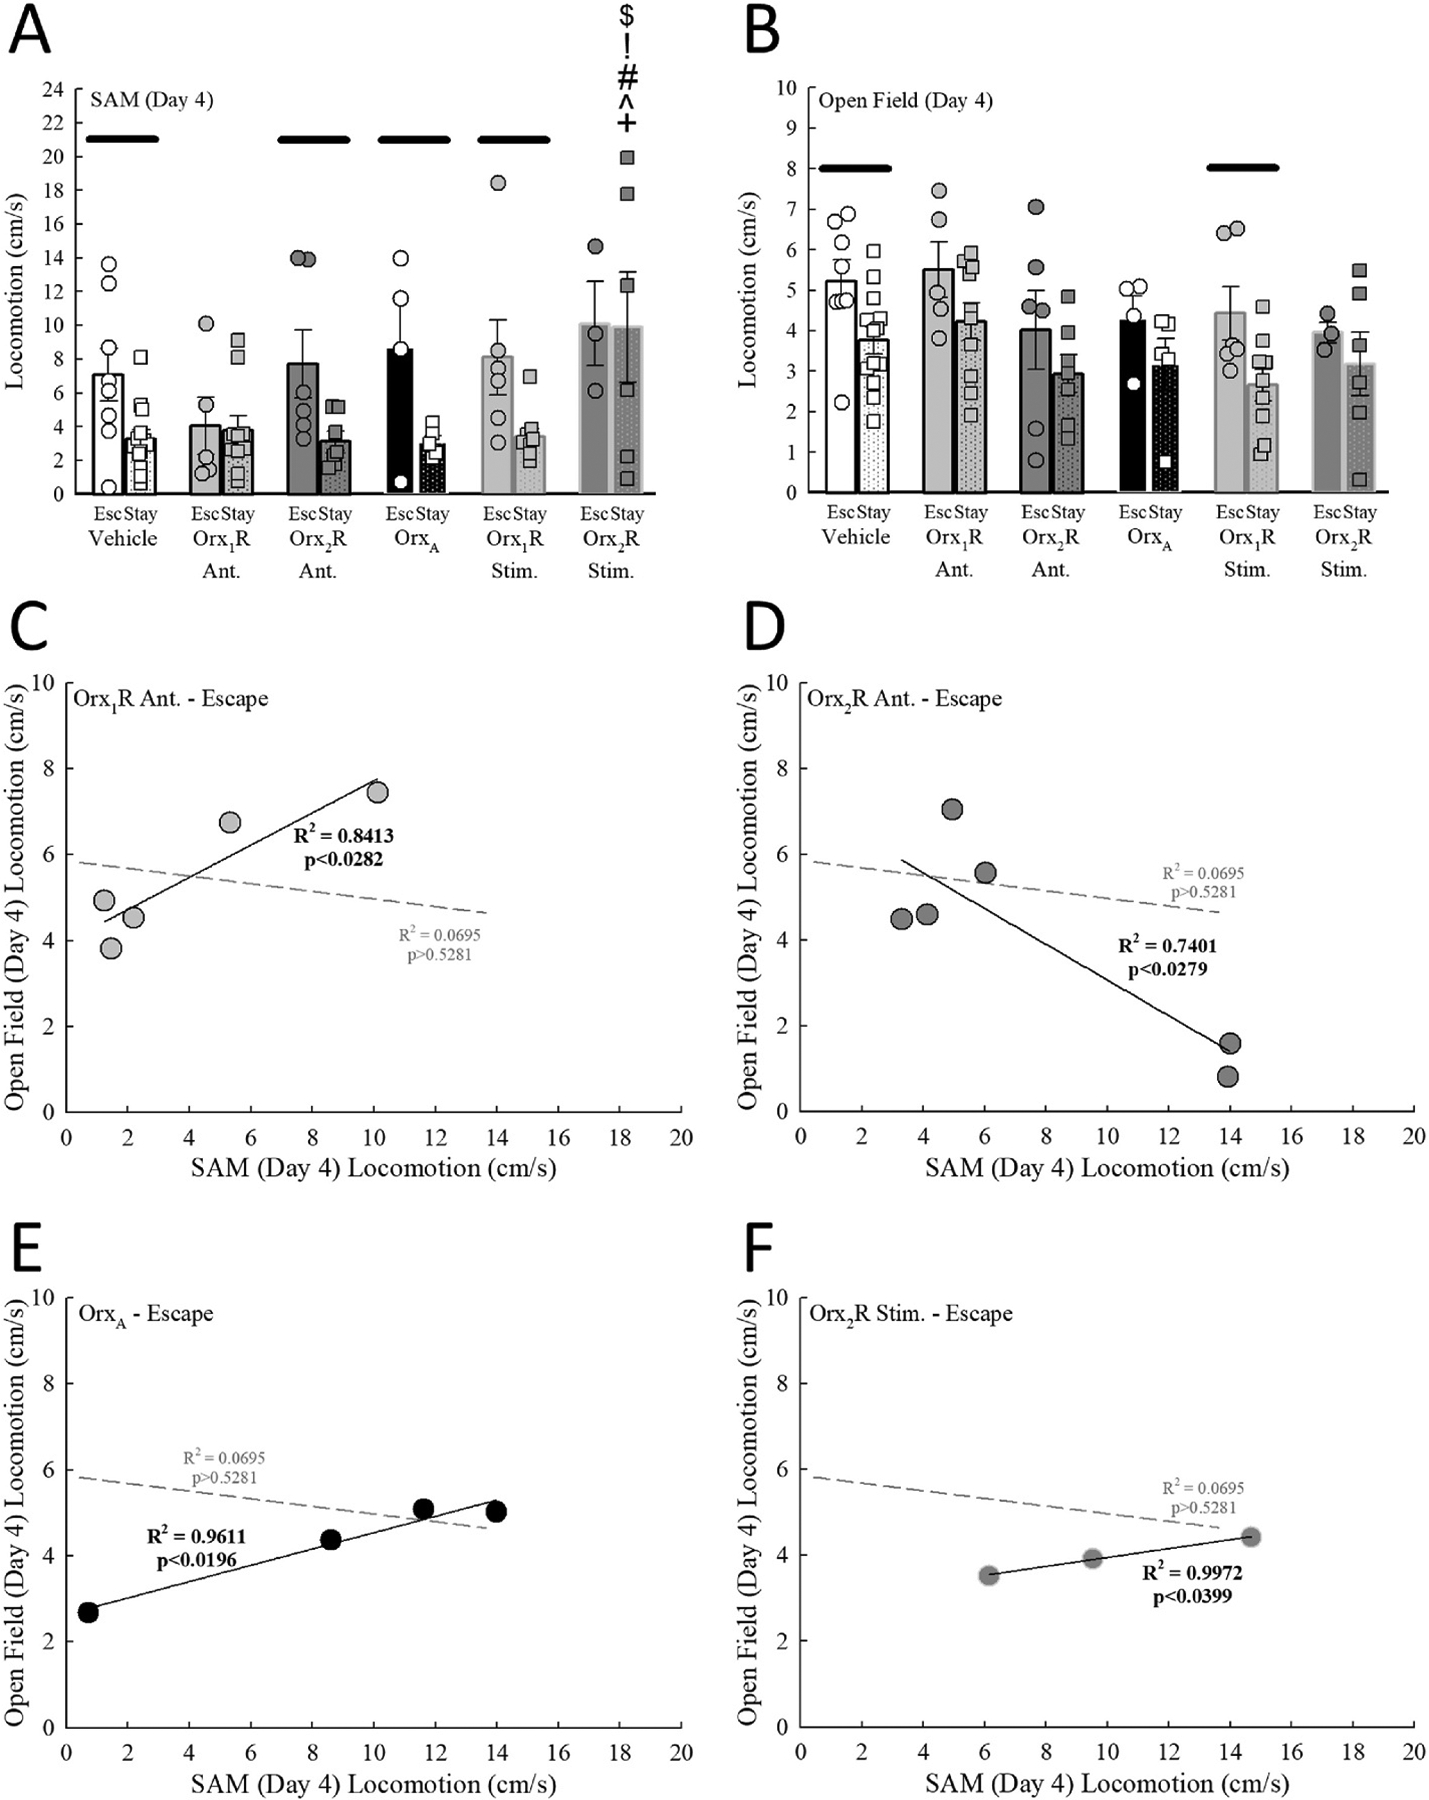
Fig. 4.

Social stress-induced locomotion in SAM is generalized/transferred to a non-social OF Test environment after intra-BLA manipulation of Orx receptor activity in Escape animals. A) Escape mice express higher locomotor activity compared to Stay animals during social stress in the SAM, but this phenotype difference is not observed after intra-BLA Orx1R antagonism (Drug Effect, F5,70 = 2.6, p ≤ 0.033; Phenotype Effect, F1,70 = 11.9, p < 0.001). Also, infusion in the BLA of an Orx2R agonist enhances locomotion in the SAM in Stay mice. B) While Escape animals in the vehicle control group display higher locomotion compared to Stay mice in the OF Test, this divergent phenotype response is not observed after intra-BLA Orx1R or Orx2R antagonism (Drug Effect, F5,70 = 2.1, p ≥ 0.071; Phenotype Effect, F1,70 = 12.6, p < 0.001). Similarly, OrxA and Orx2R stimulation eliminates the difference in locomotion between Escape and Stay mice in the OF Test. C) Unlike vehicle controls (gray dotted line represents vehicle control linear regression line, F1,12 = , R2 = 0.0695, p ≥ 0.5281), a significant positive relationship between SAM and OF Test locomotion is observed in Escape mice treated with an Orx1R antagonist (F2,3 = 15.9, R2 = 0.8413, p ≤ 0.0282). D) A significant negative correlation is revealed between SAM and OF Test locomotion in Escape mice treated with an Orx2R antagonist (F1,4 = 11.4, R2 = 0.7401, p ≤ 0.0279; dotted gray line represents vehicle control regression line). Like Orx2R antagonism, significant positive associations between locomotor activity in the SAM and OF Test for Escape mice treated with E) OrxA (F2,2 = 49.4, R2 = 0.9611, p ≤ 0.02; dotted gray line represents vehicle control regression line) or F) an Orx2R agonist (F2,1 = 351.5, R2 = 0.9972, p ≤ 0.034; dotted gray line represents vehicle control regression line). −p ≤ 0.05 for comparisons between phenotypes in the same treatment group; +p ≤ 0.005 for comparisons to Vehicle-treated mice of the same phenotype; ^p ≤ 0.005 for comparisons to Orx1R Ant. group of the same phenotype; #p ≤ 0.005 for comparisons to Orx2R Ant. group of the same phenotype; !p ≤ 0.005 for comparisons to OrxA treatment animals of the same phenotype; $p ≤ 0.005 for comparisons to mice in the Orx1R stimulation group of the same phenotype.
