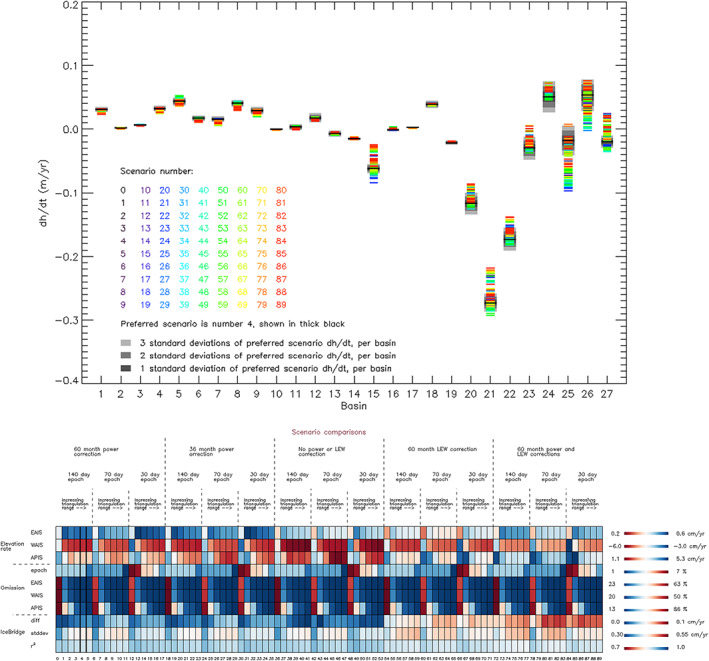
Figure 1.

(top) Average rate of elevation change in AIS drainage basins (Zwally et al., 2012) between 1992 and 2017 derived from 90 alternative processing scenarios. The optimal scenario is represented by a thick black line, with its estimated 1σ, 2σ, and 3σ uncertainty range shaded in dark, mid, and light gray, respectively. In most basins, the average elevation rate and the spread among scenarios are close to zero. Basins showing the greatest spread among scenarios are either sparsely sampled (15 and 24 to 27) or include changes in ice thickness that are large by comparison to the spread (20 to 22). (bottom) Evaluation of the alternative processing scenarios: (i) in producing average ice sheet elevation rates (top three rows, see also Figure S9), (ii) in relation to their temporal and spatial sampling (middle four rows, see also Figure S3), and (iii) in relation to their difference to precise airborne laser altimetry (Studinger, 2014; bottom three rows, see also Figure S11). Against these metrics, scenario 4 (thick border) is identified to be the optimal elevation change solution. AIS = Antarctic Ice Sheet; EAIS = East AIS; WAIS = West AIS; APIS = Antarctic Peninsula ice sheet; LEW = leading edge width.
