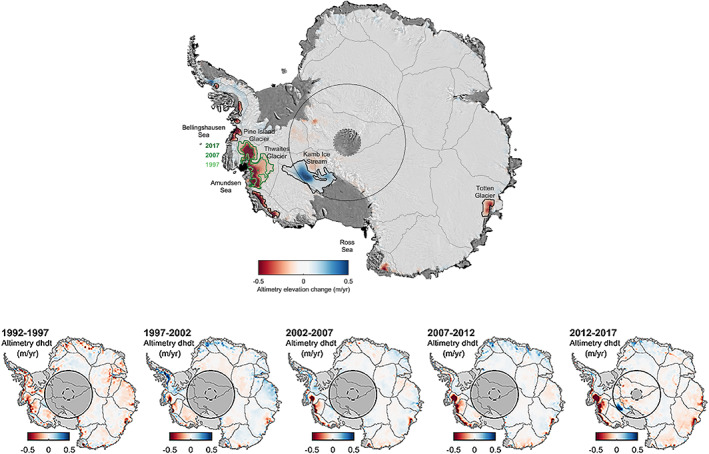
Figure 2.

Average rate of Antarctic Ice Sheet elevation change between 1992 and 2017 (top) and within successive 5‐year intervals (bottom) from satellite radar altimetry, smoothed with a 100 km Gaussian filter. Black circles at the pole indicate the southern limit of the CryoSat‐2 (dashed) and other (solid) satellite orbits. Gray boundaries show glacier drainage basins (Zwally et al., 2012). Boundaries show areas of dynamical imbalance that do not (black) and do (green) evolve over time.
