
Fig. 2.
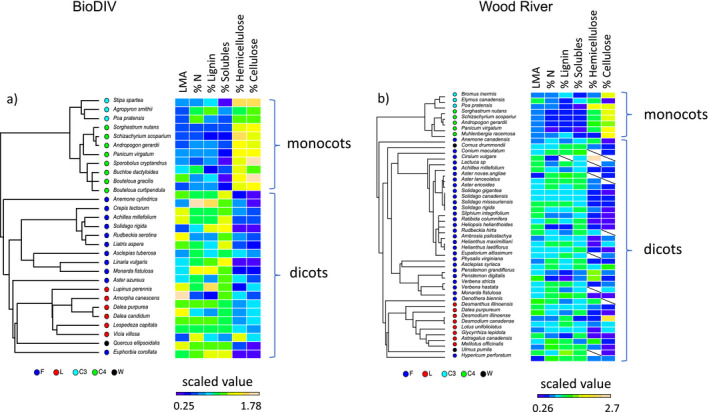
Phylogenetic relationships among species, their functional group categories (forbs, F; legumes, L; C3 grasses, C3; C4 grasses, C4; and woody species, W) and their foliar functional and chemical composition (leaf mass per area, LMA; % N, % lignin; % cell solubles; % hemicellulose, and % cellulose) in (a) the BioDIV experiment at Cedar Creek and (b) the Wood River experiment in Nebraska. Note that F, L and W groups are nested within the dicot lineage and C3 and C4 grasses are nested within the monocots. Functional trait values are scaled—centered to their means and divided by their standard deviations—and color‐coded with blue colors indicating low values and yellow or salmon colors indicating high values. Missing values are indicated by a slash.