
Fig. 7.
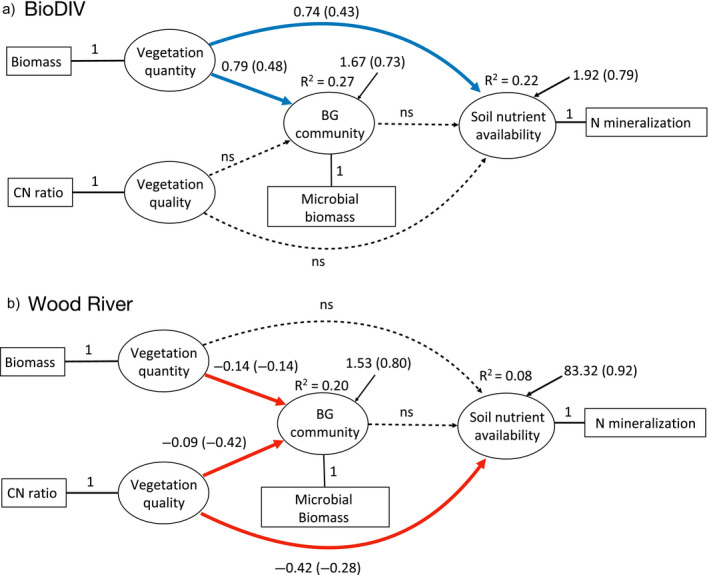
Structural equation models reveal the relative importance of aboveground quantity and quality of vegetation inputs for belowground microbial processes and soil nutrient availability and their interrelations in the BioDIV (chi‐squared = 0.30, df = 1, P = 0.59) (a) and Wood River (chi‐squared = 0.02, df = 1, P = 0.89) (b) experiments. In each model, the latent variable constructs (ovals) are represented by measured variables (rectangles). Vegetation quantity and quality are represented by aboveground biomass (“Biomass”) and vegetation carbon to nitrogen ratio (“CN ratio”), respectively. The latent construct of belowground microbial community functions (“BG community”) is represented by microbial biomass carbon (“Microbial biomass”), while the soil nutrient availability is represented by net nitrogen mineralization rate (“N mineralization”). Blue arrows indicate significant positive relationships. Red arrows indicate significant negative relationships. Dashed lines non‐significant relationships. Coefficients and standardized coefficients (in brackets, one unit change in the predictor variable causes the amount of one standardized coefficient change in the dependent variable) are given next to the arrows. Predictor variables were converted the following way: one unit of biomass in the model equals measured dry plant biomass (g/m2)/100, one unit net nitrogen mineralization rate in the model equals (1 + measured N (mg)·[g soil]−1·d−1) × 100, and one unit microbial biomass carbon in the model equals for BioDIV (measured microbial biomass C·[g soil]−1) × 100 and for Wood River (1 + measured microbial biomass C·[g soil]−1) × 10.