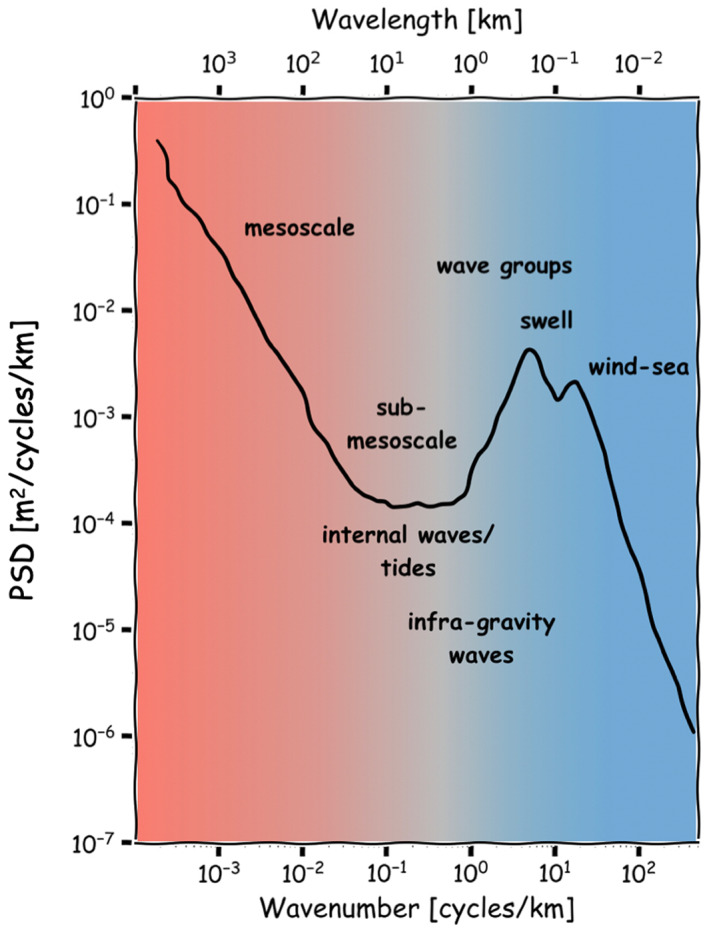
Figure 1.

Schematic representation of a broadband spectrum of the sea surface height (SSH). The shading on the background indicates the three different spectral zones defined in this paper: red, gray, and blue zones. Words (in black) indicate the main physical processes that contribute to the SSH variance on each zone.
