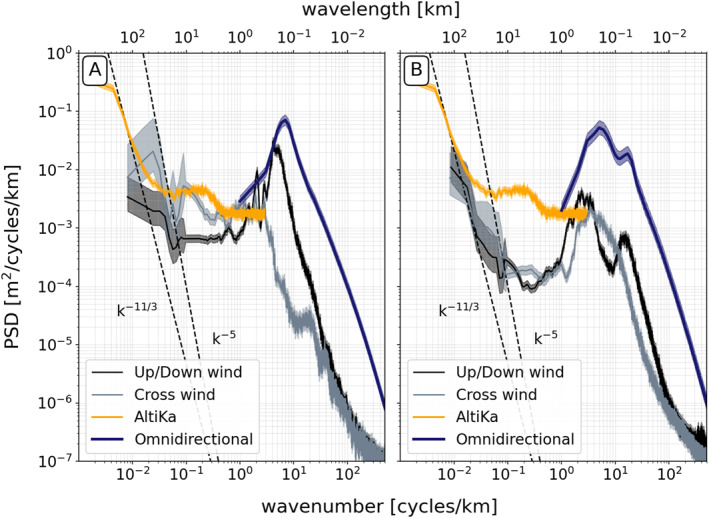
Figure 3.

(a) Wavenumber spectrum of the cross‐track averaged sea surface height anomaly (SSHA) from Modular Aerial Sensing System (MASS) for the 28 March 2019 flights. The spectrum averaged across all up/down‐wind tracks is shown in black and the average cross‐winds in gray. The same omnidirectional spectrum shown in Figure S1b in Supporting Information S1 is shown in dark purple. The mean wavenumber spectrum from Chereskin et al. (2019) computed using along‐track AltiKa measurements off the California coast is shown in gold for reference. (b) Same as (a), but for the 10 April 2019 flights.
