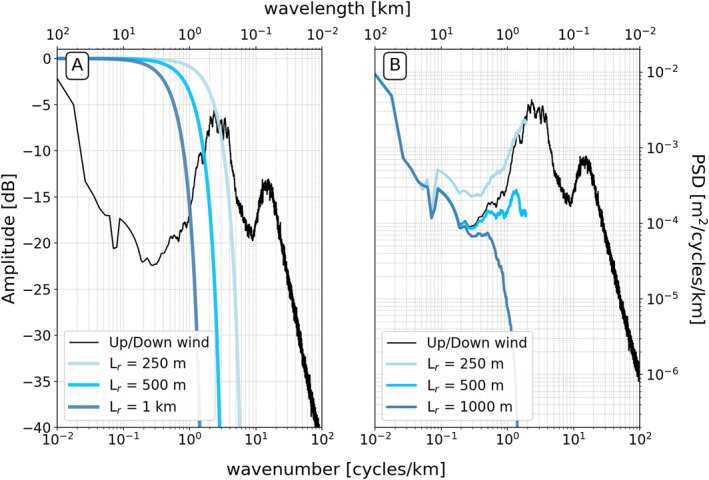
Figure 4.

(a) Wavenumber spectrum of the cross‐track averaged sea surface height anomaly (SSHA) from Modular Aerial Sensing System (MASS) for the 9 April 2019 flights (same as Figure 3b). The mean spectrum of the up/down‐wind tracks is shown in black and the cross‐wind tracks in gray. The colored lines are the transfer function of a Blackman‐Harris window with feature resolution (see main text) of 250 m (light blue), 500 m (sky blue), and 1 km (dark blue). (b) Wavenumber spectrum of the cross‐track averaged SSHA from MASS for the 9 April 2019 flights (same as Figure 3b). The mean spectrum of the up/down wind tracks is shown in black. The colored lines are the spectrum after filtering the signal with a Blackman‐Harris window with feature resolution (L r ) of 250 m (light blue), 500 m (sky blue), and 1 km (dark blue), and subsampling at 250 m postings.
