
FIGURE 3.
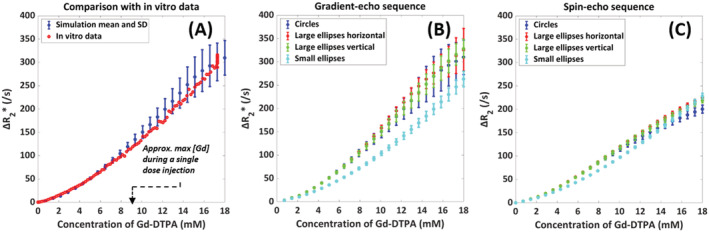
Simulation data (blue) for arterial blood with a hematocrit value of 36% and field strength of 1.5 T for a gradient‐echo sequence with TE = 20 ms, TR = 1 s, and FA = 90° in comparison with in vitro data (red), including the mean and SD over the different red blood cell (RBC) configurations (A). The in vitro data are from van Osch et al. 2 The dashed arrow indicates the approximate maximum contrast concentration during a single dose injection. (B) and (C) show the influence of magnetic field direction on the relation between [Gd‐DTPA] and ΔR2 (*) in arterial blood by simulating different shape and surface areas of the RBCs, including the mean and SD over the different RBC configurations. The large ellipses and circles are equal in surface area and are different from the small ellipses. The number of small ellipses was higher to achieve the same hematocrit value for all different RBC types. The results are shown for both gradient‐echo (B) and spin‐echo (C) sequences. The blue curve for the circles in (B) is equal to the results in (A)