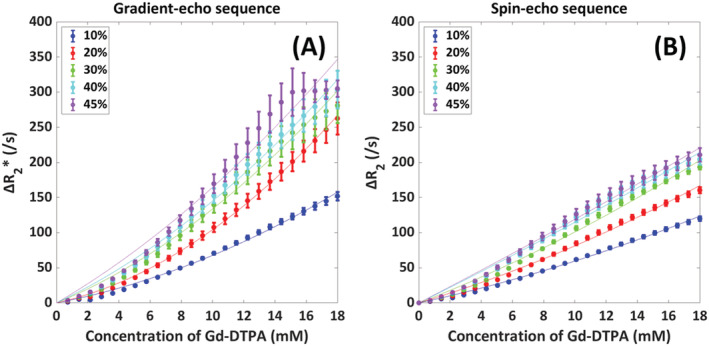
FIGURE 4.

Influence of hematocrit value (10%, 20%, 30%, 40%, 45%) on the relation between [Gd‐DTPA] and ΔR2 (*) in arterial blood with the mean and SD as calculated over five different red blood cell configurations. The resulting fits to a second‐order polynomial, defined as ΔR2 (*) = a*[Gd]2 + b*[Gd], are depicted by the thin solid lines. The results are shown for both gradient‐echo (A) and spin‐echo (B) sequences
