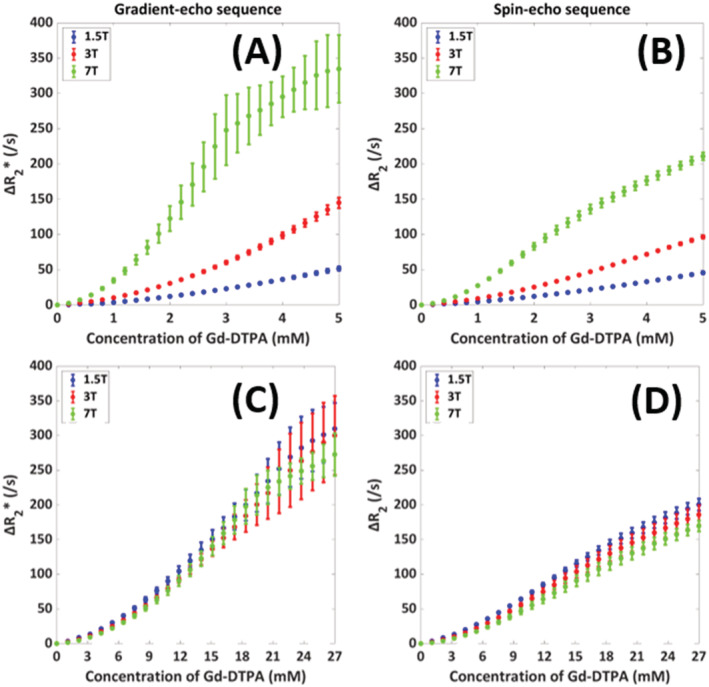
FIGURE 5.

Influence of field strength (1.5, 3, and 7 T) on the relation between [Gd‐DTPA] and ΔR2 (*) in arterial blood with the mean and SD as calculated over five different RBC configurations. In (A) and (B), the x‐axis shows the concentration of Gd‐DTPA, while in (C) and (D) the concentration was scaled by the field strength to allow for a better comparison of the shape of the relation. The results are shown for both gradient‐echo (A and C) and spin‐echo (B and D) sequences
