
Figure 6.
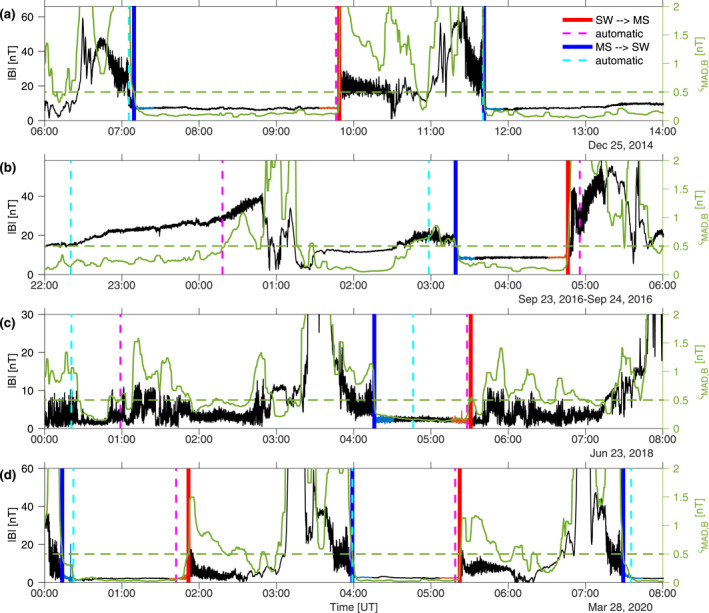
Examples of total magnetic field amplitudes |B| at 1 s resolution measured by the MAVEN/MAG instrument throughout the mission (left y‐axes), and calculated running median absolute deviations ς mad,B (right y‐axes in green). (a) 25 December 2014 (beginning of mission). The first crossing is quite oblique (θ Bn ≈ 45°) followed by two highly q ⊥ shock crossings (θ Bn 85°). (b) 23–24 September 2016. The two detected crossings are q ⊥, the first one with θ Bn ≈ 58°, the second with θ Bn ≈ 78°. (c) 23 June 2018, with two detected q ‖ crossings (θ Bn ≈ 8, 25°). (d) 28 March 2020, with five crossings all oblique toward q ⊥ conditions, with θ Bn ≈ 45°, 49°, 80°, 82°, and 88°, successively. The predictor geometric detections (Section 3.1) are in dashed lines and labeled “automatic,” whereas the predictor‐corrector detections proposed in Section 3.2 are in solid lines. Highlighted in different colors are crossings from solar wind to magnetosheath (labeled SW → MS, red) and from magnetosheath to solar wind (labeled MS → SW, blue). Calculations of θ Bn angles were performed using median averages of B over the color‐highlighted regions (blue for MS → SW crossings, red for SW → MS crossings). The threshold ς th = 0.5 is shown as a horizontal dashed line (right y‐axis, green).