
Figure 4.
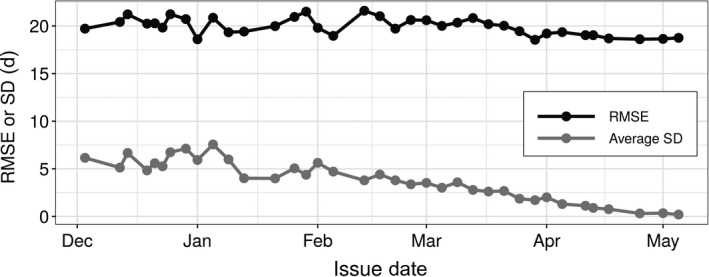
The root mean square error (RMSE) and the average uncertainty (SD) of forecasts issued between 2 December 2018 and 5 May 2019 for 1,581 phenological events representing 65 species. The y‐axis scale is in days (d) for both RMSE and SD.
Official websites use .gov
A
.gov website belongs to an official
government organization in the United States.
Secure .gov websites use HTTPS
A lock (
) or https:// means you've safely
connected to the .gov website. Share sensitive
information only on official, secure websites.
The root mean square error (RMSE) and the average uncertainty (SD) of forecasts issued between 2 December 2018 and 5 May 2019 for 1,581 phenological events representing 65 species. The y‐axis scale is in days (d) for both RMSE and SD.