
Figure 5.
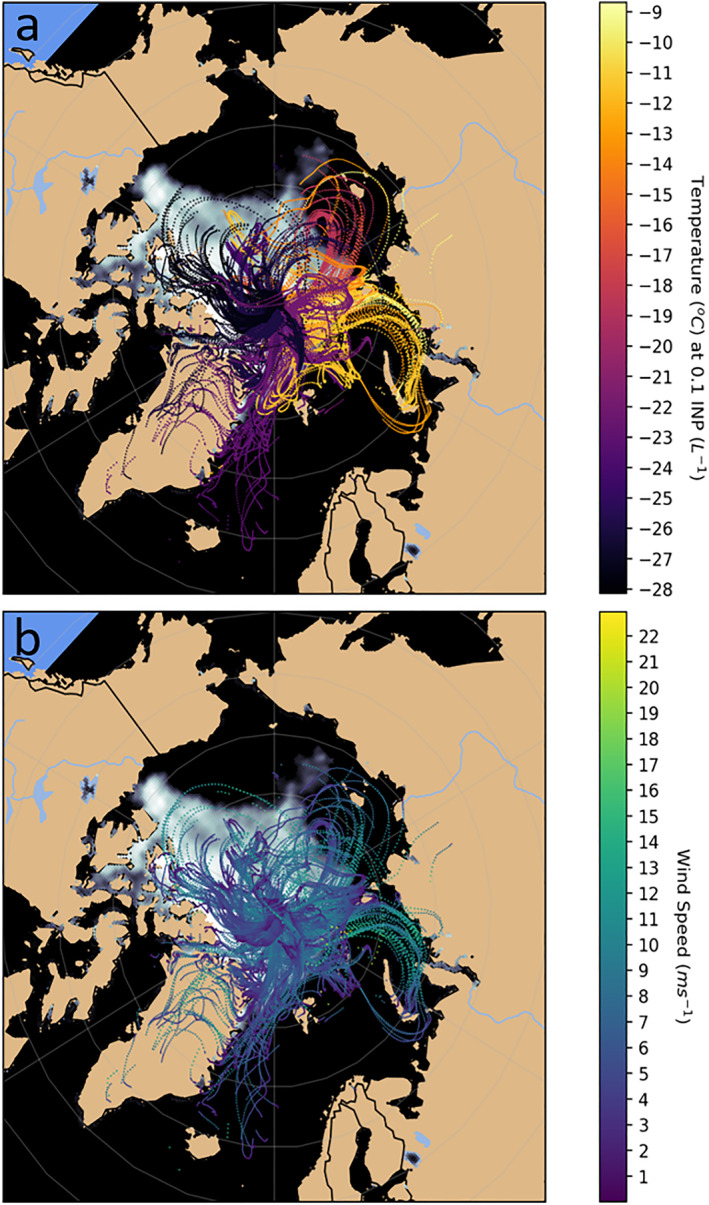
Backward trajectories over 7 days, starting at the ship location, for the INP samples taken throughout the campaign. Trajectories were launched every hour during the sampling period, and each point represents an hour in time along the back trajectory. The starting height for the trajectories was 32 m above mean sea level. Any points along the trajectories which were above the model boundary layer and any points along the trajectory that preceded precipitation events (>0.1 mm hr−1) were removed. Hence, any potential sources of INP in the boundary layer are neglected if they occurred prior to a precipitation event (we assume precipitation removes INPs). (a) The color of the trajectories represents the temperature at which 0.1 INP L−1 was measured for that sampling period. (b) The color of the trajectories represents the wind speed for each point along the trajectory. The sea ice extent is from the NASA National Snow and Ice Data Center (Maslanik & Stroeve, 1999).