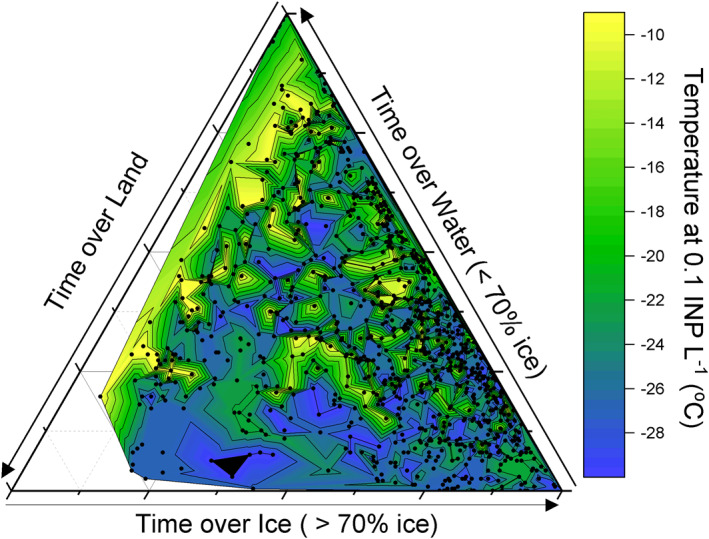
Figure 6.

The time that air masses spent over water, ice and land derived using back trajectory analysis. The color represents the temperature at which an INP concentration of 0.1 INP L−1 was reached. The black dots correspond to individual trajectories. The same filters as in Figure 5 were applied.
