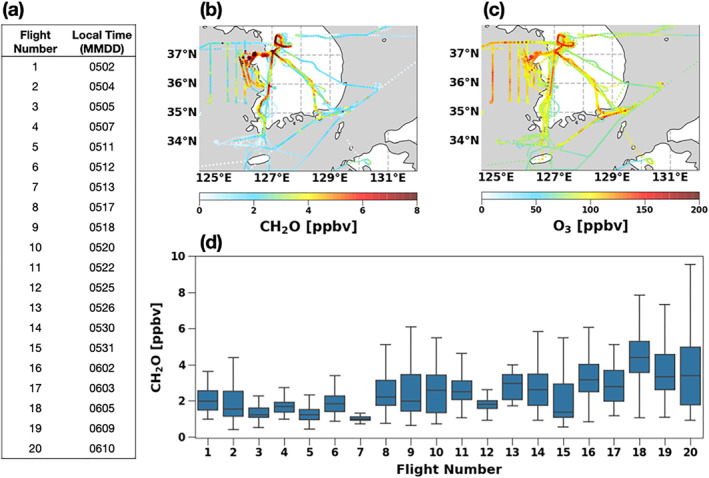
Figure 1.

(a) KORUS‐AQ DC‐8 aircraft flight dates in May–June 2016, DC‐8 aircraft observations of (b) CH2O [ppbv] and (c) O3 [ppbv] collected across all flights during the KORUS‐AQ campaign and (d) individual flight average observations of CH2O [ppbv] (blue boxes show the quartiles) sampled below 1 km.
