
Figure 10.
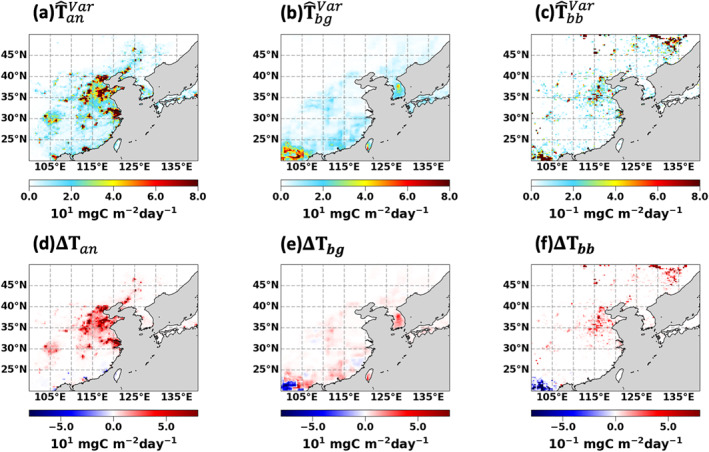
Top: the hybrid a posteriori total VOC emissions at 0.25° × 0.3125° resolution during the KORUS‐AQ campaign period from (a) anthropogenic , (b) biogenic , and (c) biomass burning sectors. Bottom: the emission changes from the a priori total VOC emissions for (d) anthropogenic (ΔT an ), (e) biogenic (ΔT bg ), and (f) biomass burning (ΔT bb ) sectors. Units are Gg C day−1.