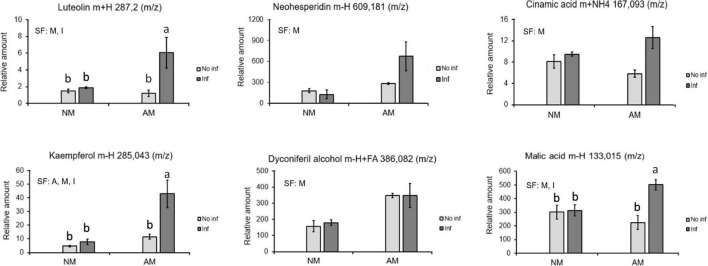
FIGURE 7.
Identified compounds displaying a priming profile in mycorrhizal C. aurantium plants 48 h after T. urticae infestation. Four different treatments were employed in all the cases: NM: non-mycorrhizal SO plants. AM: mycorrhizal SO non-infested plants. NM inf: non-mycorrhizal infested plants. AM inf: mycorrhizal infested plants. Compounds were identified using exact mass and fragmentation spectrum. Peak intensity was obtained by using MarVis filter and cluster following a Kruskal–Wallis test (P < 0.05). Relative amount of the metabolites was determined by normalizing the chromatographic area of each compound with the dry weight of its sample. Data was presented as a mean of five replicates ± SD (n = 5). Significant factors (SF) indicate if the two independent factors: A (Arbuscular Mycorrhizal), M (Mite infestation) and/or their interaction I (A × M) were statistically significant (Two-way ANOVA, P < 0.05). Different letters indicate significative differences (Tukey HSD test, P < 0.05). The stats of analysis are provided in Supplementary Table 1.

