FIGURE 1.

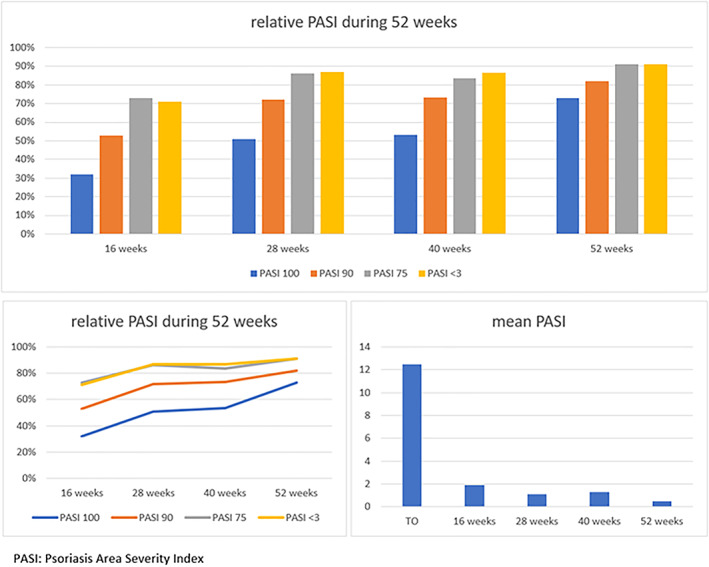
Graphic reduction in mPASI and in the achievement of PASI 100, 90, 75, and <3 in general population during weeks 16, 28, 40, and 52

Graphic reduction in mPASI and in the achievement of PASI 100, 90, 75, and <3 in general population during weeks 16, 28, 40, and 52