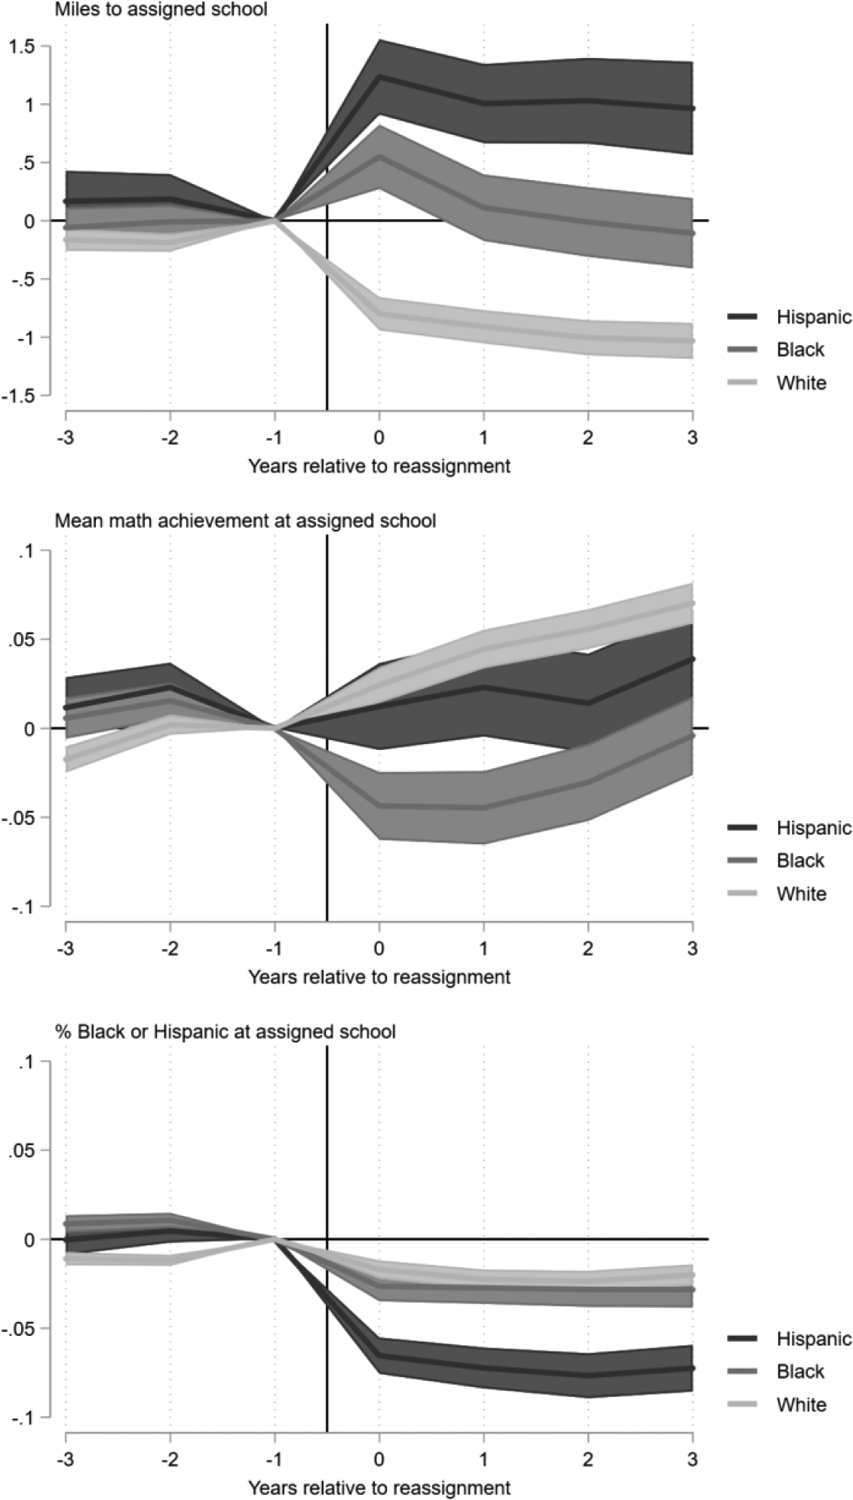
Figure 2: Effects of reassignment on characteristics of assigned school, estimated separately for Black, Hispanic, and White students.

Note: Data are drawn from WCPSS administrative records. Distance to assigned school data are available for students in all grades and years with administrative data; mean math achievement data are available for all students in years in which their assigned school enrolls students in grades 3–8; proportion Black and Hispanic data are available for students in all grades and years with administrative data. All models include controls for gender, special education, and ELL status; percent of students reassigned into student’s assigned school, percent of students reassigned out of student’s assigned school, node-by-grade fixed effects, year fixed effects as described in Equation (1). See Appendix Table 1 for full model results.
