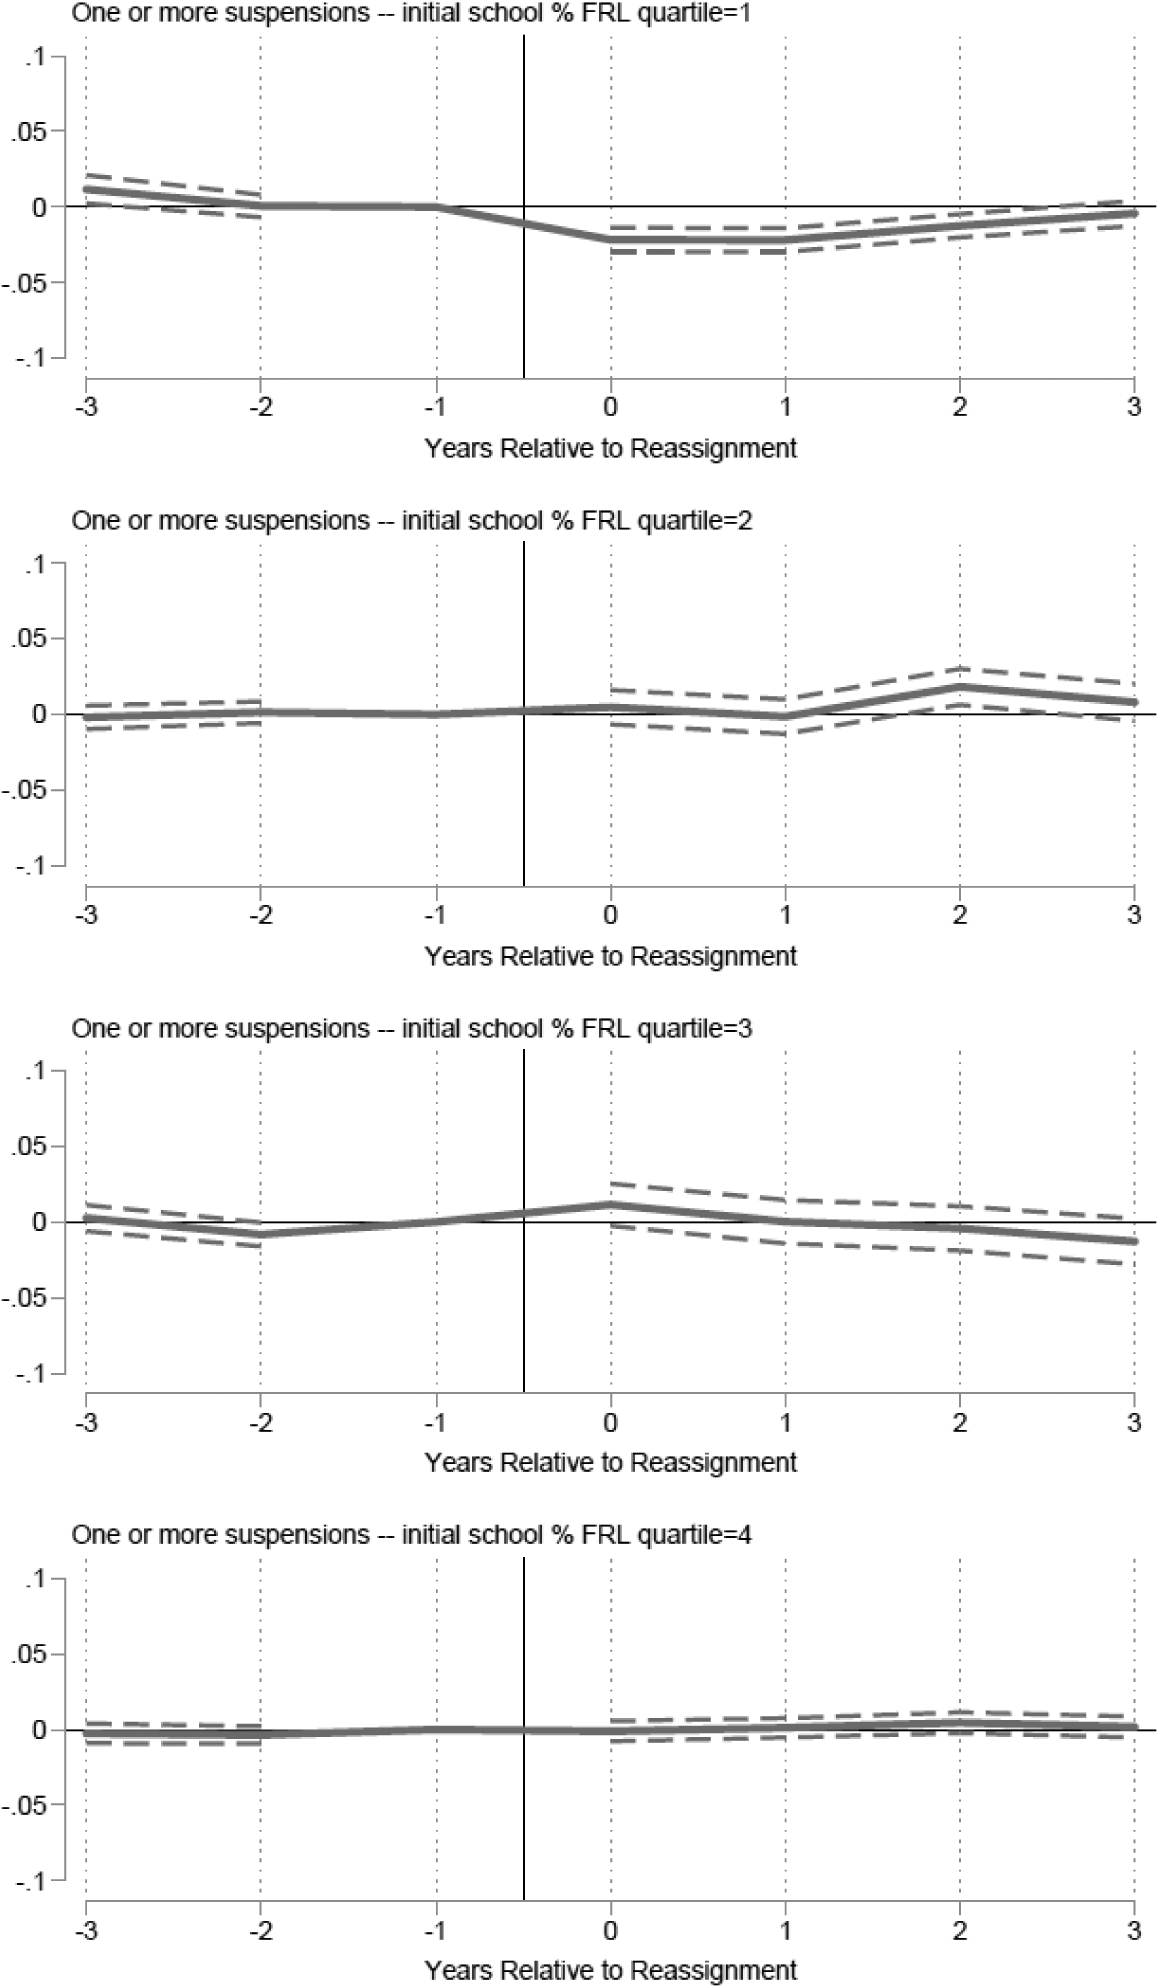
Appendix Figure 4: Effects of reassignment on probability of suspension, estimated separately by quartiles of free/reduced price lunch enrollment at students’ assigned school.

Note: Data are drawn from WCPSS administrative records. Suspension data are available for students in all grades and years with administrative data. All models include controls for student race/ethnicity, gender, special education, and ELL status; percent of students reassigned into student’s assigned school, percent of students reassigned out of student’s assigned school, node-by-grade fixed effects, year fixed effects as described in Equation (1). While all models include terms for 4 or more years before and after reassignment, these are not reported here due to imprecision. One year before reassignment represents the reference year and is indicated by “—”.
