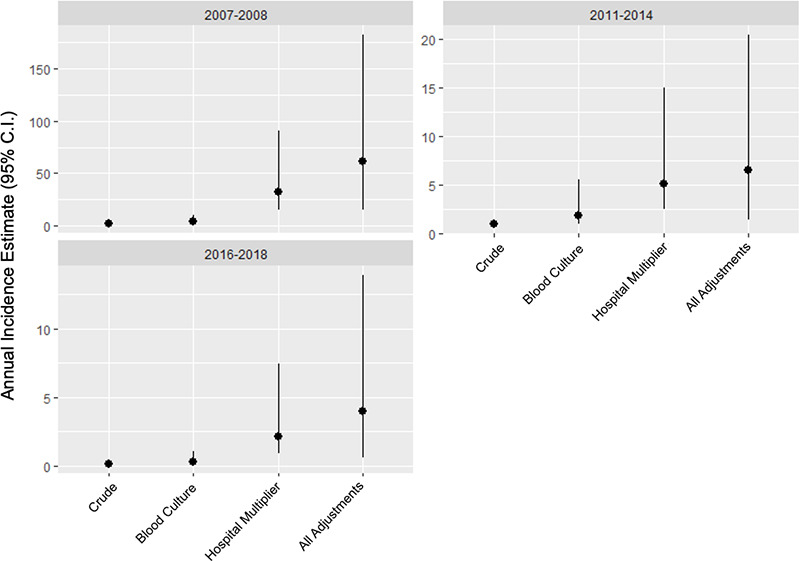
Fig 3. Crude incidence and key adjustments of incidence estimates using hybrid surveillance and Bayesian hierarchical model, Kilimanjaro Region, Tanzania, 2007–2018.

The graphs depict the application of the multiplier method and Bayesian estimation model for each study period in order to show the adjustments from an initial crude incidence to the final incidence point estimates (per 100,000 persons) and to show the credible intervals around the point estimates at each stage of adjustment. The crude incidence is first adjusted to account for the imperfect sensitivity of Blood Culture; this adjusted incidence is further adjusted by the hospital multiplier to account for case under-ascertainment by sentinel site surveillance. The far right of each plot’s x-axis, All Adjustments, reflects the full model as described in Methods and Supplementary Methods.
