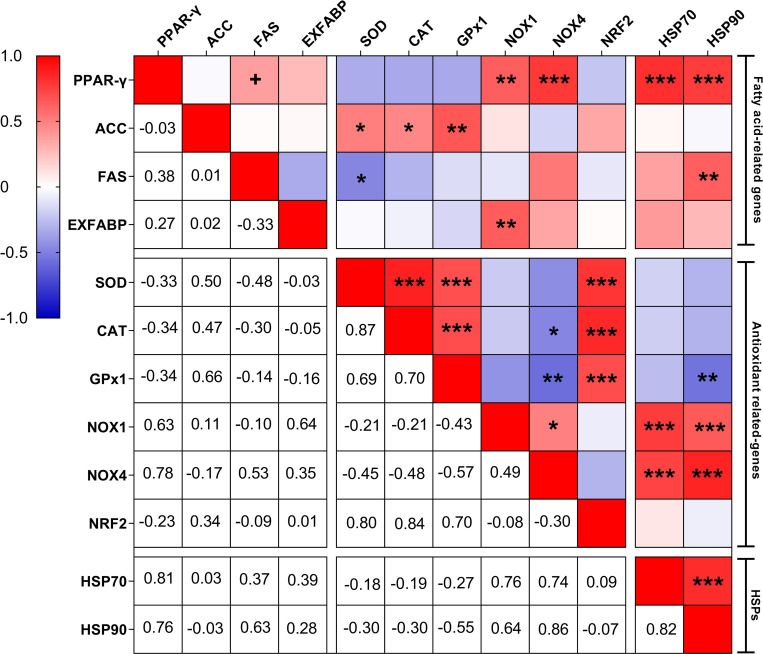
Fig 6. Pearson correlation heat map between the relative mRNA levels of the genes studied.
The red color indicates a positive correlation, the blue color indicates a negative correlation and the white color indicates no correlation. Pearson r values were calculated using the “CORR procedure” of the SAS software version 9.4 (SAS Institute Inc., 2009). Abbreviations: ACC, acetyl-CoA carboxylase; CAT, catalase; EXFABP, extracellular fatty acid-binding protein; FAS, fatty acid synthase; GPx1, HSP70, heat-shock protein 70; HSP90, heat shock protein 90; glutathione peroxidase 1; NOX1, nicotinamide adenine dinucleotide phosphate oxidase 1; NOX4, nicotinamide adenine dinucleotide phosphate oxidase 4; NRF2, nuclear factor erythroid 2-related factor 2; PPAR-γ, peroxisome proliferator-activated receptor-gamma; SOD, superoxide dismutase. + Correlation is significant at the P < 0.1. * Correlation is significant at the 0.05 level. ** Correlation is significant at the 0.01 level. *** Correlation is significant at the 0.001 level.

