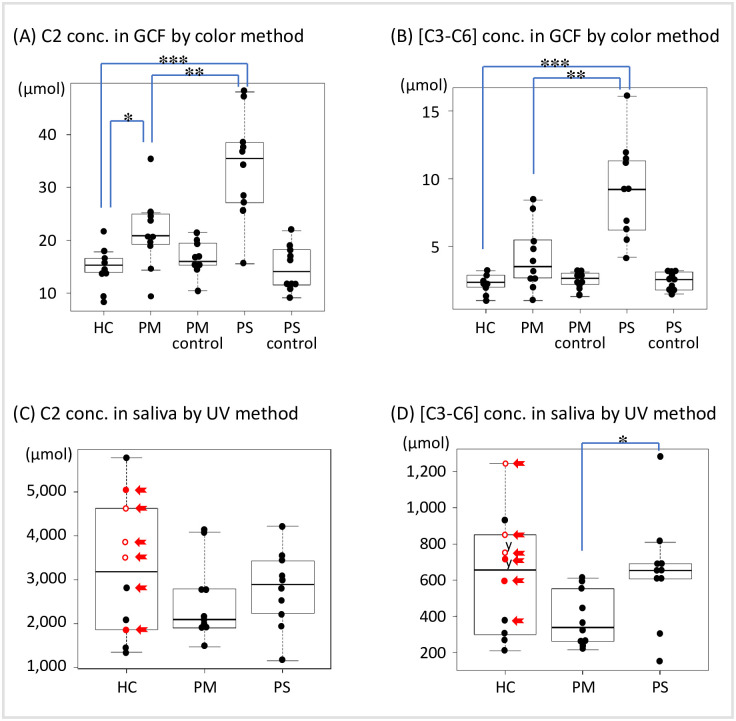
Fig 3. Concentration distribution of C2 and [C3–C6] in periodontal disease severity.
(A) C2 and (B) [C3–C6] in the GCF were measured using the color method. (C) C2 and (D) [C3–C6] in the saliva were measured using the ultraviolet rays method as in Fig 2. C2 and [C3–C6] concentrations in the saliva and GCF are shown in a boxplot with the interquartile range. Mann–Whitney U test; *: p<0.05, **: p<0.01, *** p<0.001. The samples of PM control and PS control shown in (A) and (B) are GCF samples collected from healthy teeth (PD≤3 mm) from the PM and PS groups. The red closed dots indicate a PISA>100 mm2, and the open dots indicate a PISA>300 mm2 after 1.5 years. The red arrow indicates the sample in which Porphyromonas gingivalis was present in the GCF. C2, acetic acid; [C3–C6], propionic acid, butyric acid, isobutyric acid, valeric acid, isovaleric acid, and caproic acid; GCF, gingival crevicular fluid; PM, mild group; PS, severe group; PD, probing depth; PISA, periodontal inflamed surface area.

