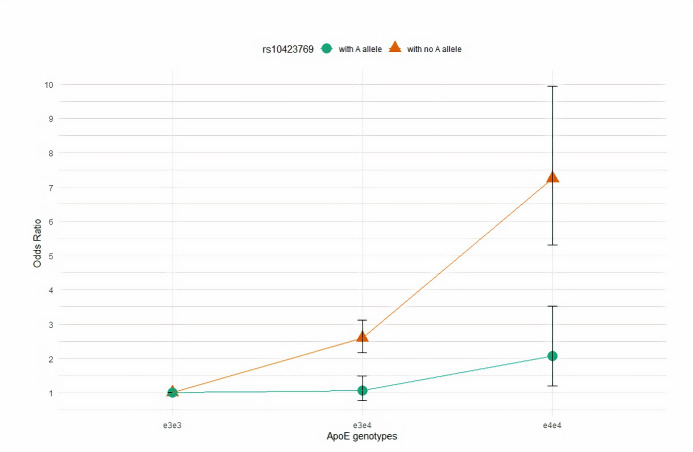
Fig 3. The plot illustrates odds ratios for ε3/ε4 and ε4/ε4 genotypes relative to ε3/ε3 individuals in the combined African American and Ibadan individuals stratified by the rs10423769_A allele.
Subgroup odds ratios (95% CIs) are denoted by green color (circle) for rs10423769_A allele carriers and brown color (triangular) for no rs10423769_A allele carriers.

