Figure 1.

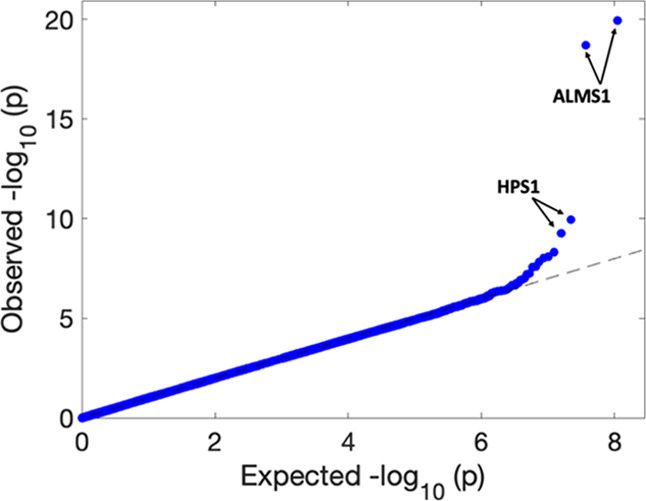
QQ-plot of −log10 (p values) of metabolome- and transcriptome-wide association analysis. The highly significant associations (FDR < 0.05) with ALMS1 expression are ranked 1st and 2nd and with HPS1 expression 3rd and 4th.

QQ-plot of −log10 (p values) of metabolome- and transcriptome-wide association analysis. The highly significant associations (FDR < 0.05) with ALMS1 expression are ranked 1st and 2nd and with HPS1 expression 3rd and 4th.