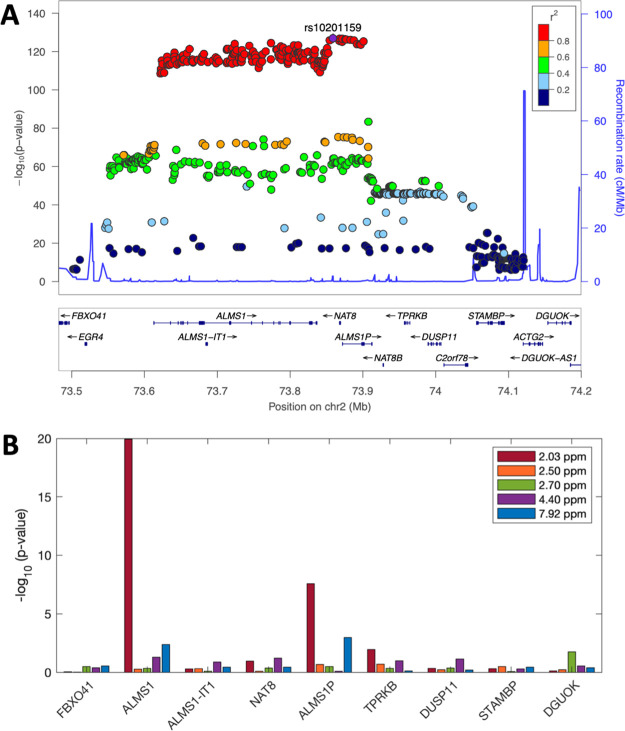
Figure 3.
SNP - metabolome feature and SNP - gene expression associations in ALMS1/NAT8 locus. (A) LocusZoom plot for ALMS1/NAT8 locus, where the SNPs are associated with metabolome feature at 2.0375 ppm, LD colored with respect to lead mQTL. (B) Bar plot shows −log10 transformed p values from associating expression values of nine genes in the locus with the five NAA features.

