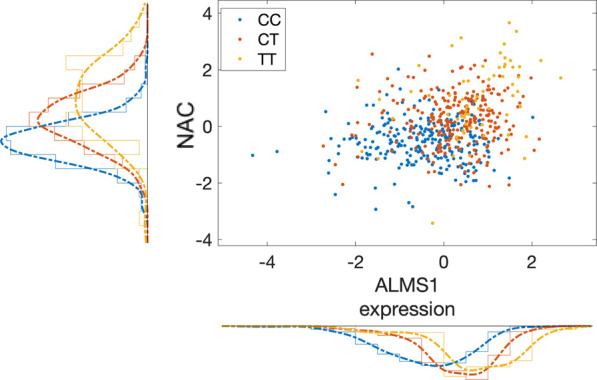
Figure 5.

Scatter plot of the mQTL effect of SNP (rs7566315) on NAC and its eQTL effect on ALMS1 gene expression. Each point represents a study sample. NAC concentration is approximated by the feature at 2.0375 ppm that is log10 transformed after feature- and sample-wise z-scoring (y axis). ALMS1 expression is z-scored after log2 transforming RPKM+1 values (x axis). Color code represents the genotype of rs7566315 (legend) that is an eQTL of ALMS1 and mQTL of NAA.
