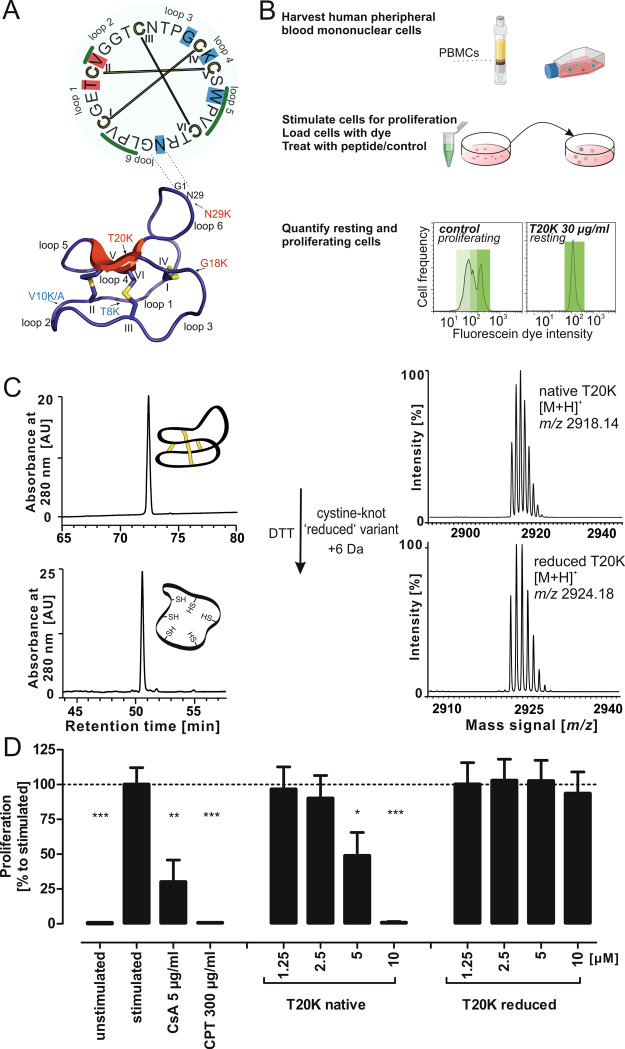
Figure 1.
Structure of the cyclotide T20K and antiproliferative activity of native vs reduced peptide. (A) A schematic illustration of the head-to-tail cyclized peptide T20K is provided. A cyclic sequence is shown on the top, the disulfide connectivity is indicated in yellow bars, and bold Roman letter numbers the cysteines from the first one in the originating gene. The intercysteine loops are also labeled beginning from the native N-terminus. Previous mutational studies are highlighted (amino acid with background colors): red indicates loss of function residues and blue indicates residues amenable for mutagenesis without changing the bioactivity of the peptide. Residues identified to contribute to the hydrophobic patch of T20K are indicated with a green overscore. The 3D structure of T20K is modeled in a cartoon form. β-sheet structures are shown in red, and cystines are shown in yellow color. The intercystine loops and cysteine residue numbering are equivalent to the circular illustration. The residues studied via amino acid mutagenesis are indicated with an arrow (red shows active and blue color assigns inactive mutants). (B) A schematic illustration of the proliferation assay is shown to the right. The isolated naïve cells become activated for proliferation by the T-cell receptor-like stimulation with anti-CD3 and anti-CD28 antibodies. The PBMCs are loaded with the CFDA-SE dye to track proliferation. The stimulated PBMCs are treated with various concentrations of peptide and with control compounds. The population of resting or proliferating cells is analyzed using fluorescence-assisted cell sorting. The prototypic peptide T20K induces a strong antiproliferative effect similar to CsA (cyclosporine A). This figure was created with BioRender.com. (C) Synthetic native folded T20K (m/z 2918.14) was treated with dithiothreitol to yield a fully reduced peptide variant (m/z 2923.18). (D) Native T20K revealed a dose-dependent antiproliferative effect, whereas the cystine knot reduced variant lost activity in the tested concentration range up to 10 μM (∼29 μg/mL). All data represent mean ± standard deviation of three biological replicates, expressed relative to stimulated control with added PBS (=100%); CsA is a positive control for an immunosuppressant, and camptothecin (CPT) is a control for an antiproliferative and apoptosis-inducing compound. Asterisks (*p < 0.05, **p < 0.01, ***p < 0.001) indicate significant differences compared to stimulated control.

