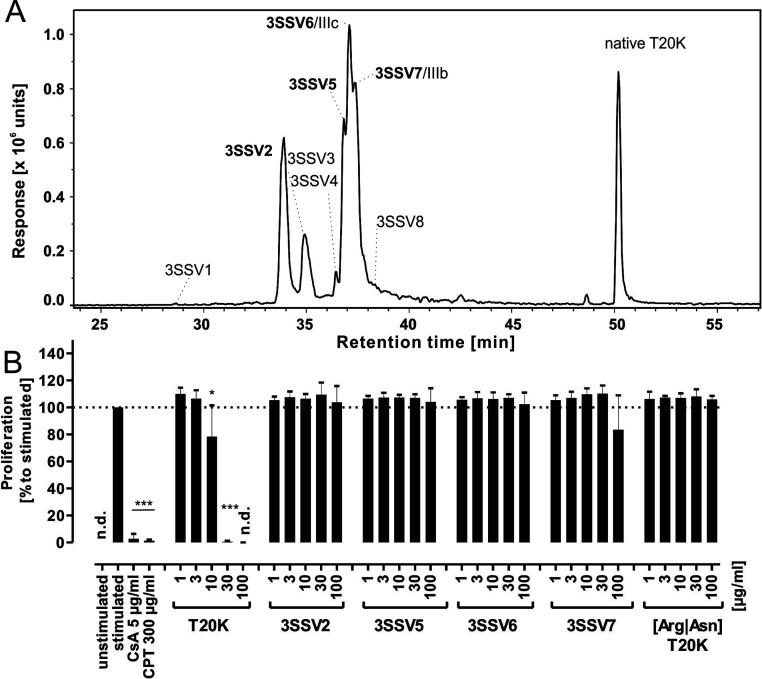
Figure 3.
Non-native folded 3SS variants and linear-folded variant. (A) LC–MS analysis of the EIC mass trace m/z 973.40 (width ± 0.02) for the [M + 3H]3+ signal of T20K derived 3SS variants. The spectral data were smoothed using a Savitzky Golay function (smoothing width 4.2 s and two data points). Fully reduced peptide was incubated in folding buffer 6 for up to 96 h. The non-native 3SS variants were generated in folding buffer, along with native folded T20K. Peaks were labeled in order of elution. Bold type denotes those species tested in the antiproliferative assays. (B) All tested 3SS variants showed abolished bioactivity over the entire tested concentration range compared to T20K. The linear-folded (Arg|Asn)T20K variant had no antiproliferative activity up to a concentration of 100 μg/mL. The data set represent mean ± standard deviation of three biological replicates, expressed relative to stimulated control (≙100%). Asterisks (*p < 0.05, ***p < 0.001) indicate significant differences compared to stimulated control, and (n.d.) indicates data not detected.

