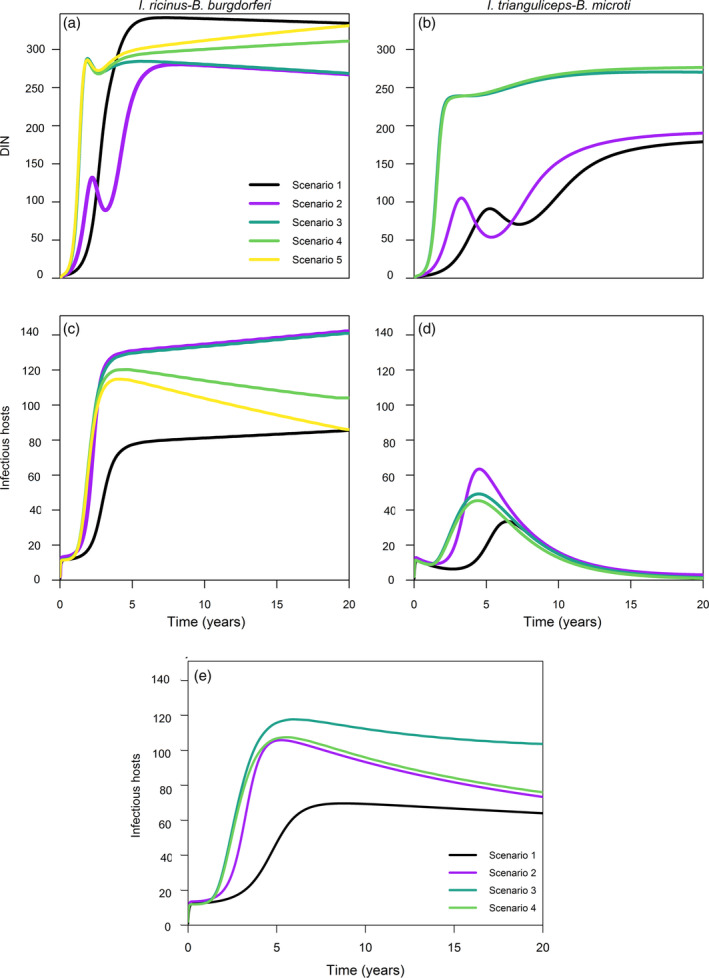
FIGURE 4.

Temporal differences of (a, b) DIN and (c, d) total number of infectious hosts in the two pathosystems over the entire simulation time (20 years). (e) Number of infectious hosts generated over the entire simulation time (20 years) by the specialist tick I. trianguliceps transmitting B. burgdorferi (modification of the second pathosystem). Black, scenario 1; purple, scenario 2; teal, scenario 3; light green, scenario 4; yellow, scenario 5. Parameter values are listed in Table 2
