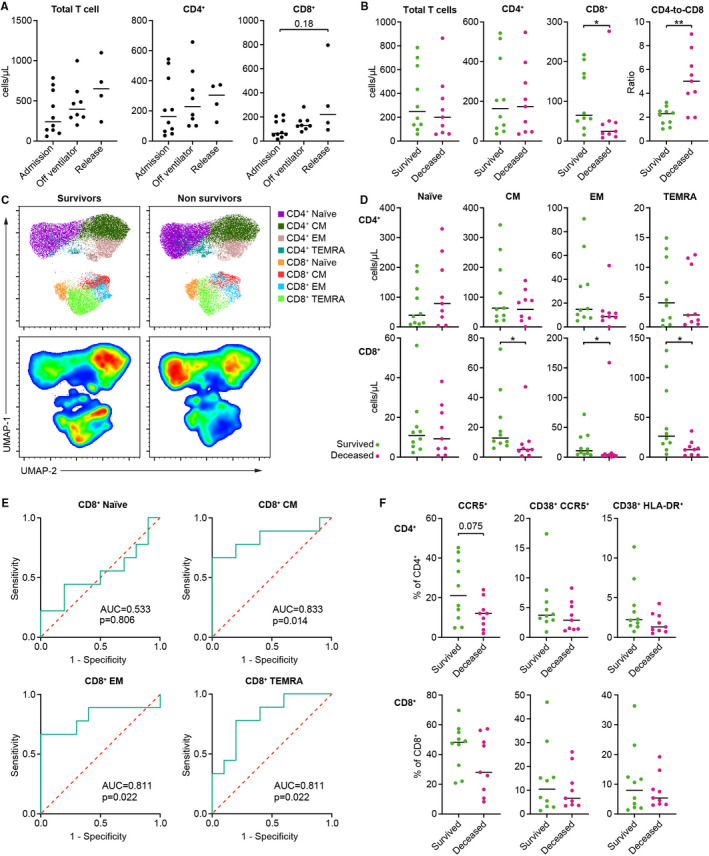
FIGURE 1.

T cell subset alterations in COVID‐19 survivors and non‐survivors. A, Cell counts of total T cells, and CD4+ and CD8+ T cell subsets at different time points in blood from severe COVID‐19 survivors (n = 10, 8 and 4 at admission, restoration of spontaneous ventilation and release from ICU respectively). B, Cell counts of total T cells, CD4+ and CD8+ T cell subsets, and CD4‐to‐CD8 ratio comparison at ICU admission between severe COVID‐19 survivors and non‐survivors. C, UMAP clustering of the CD3+ population in survivors and non‐survivors. D, Comparison of naïve (CD27+ CD45R+), CM (CD27+ CD45RA‐), EM (CD27‐ CD45RA‐) and TEMRA (CD27‐ CD45RA+) subset cell counts among CD4+ and CD8+ T cells, measured at ICU admission of subsequent survivors and non‐survivors. E, ROC curves for the total counts of main CD8+ T cell subsets. F, Frequency of CD38+ HLA‐DR+, CD38+ CCR5+ and CCR5+ T cells among CD4+ (top) and CD8+ (bottom) T cells. Data in B, D and F were analysed by Mann‐Whitney test. Asterisks indicate the level of significance. *P < .05, **P < .01
