FIGURE 3.

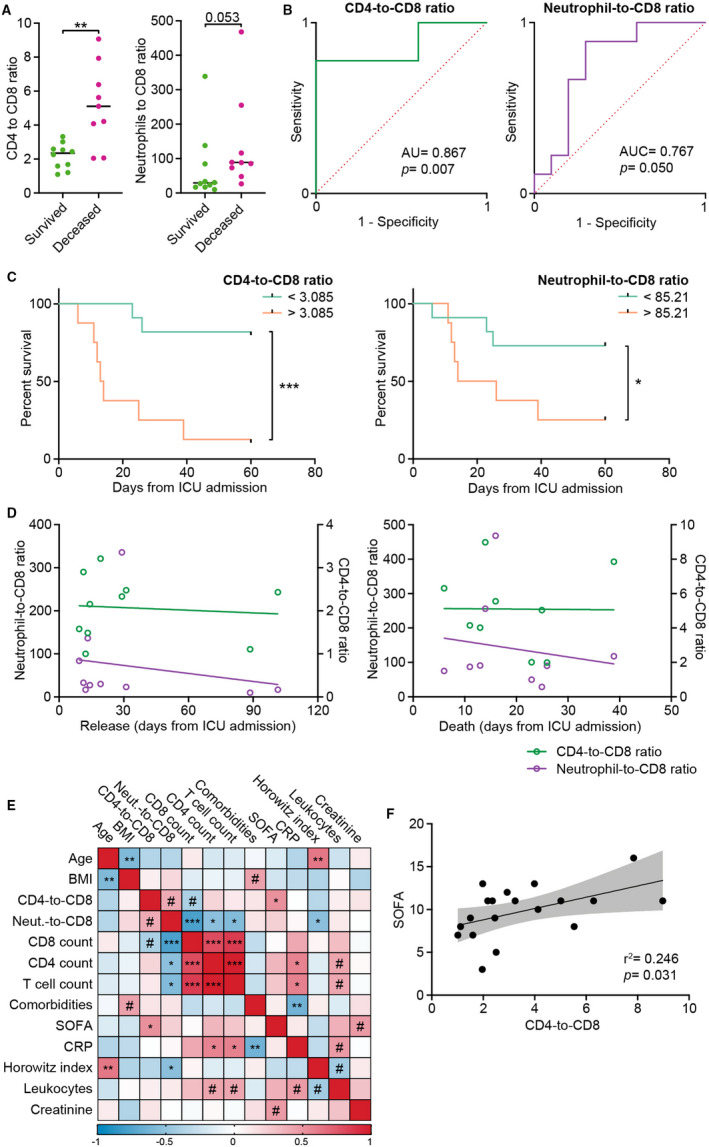
CD4‐to‐CD8 and neutrophil‐to‐CD8 ratios predict ICU mortality of severe COVID‐19 patients. A, CD4‐to‐CD8 ratio and neutrophil‐to‐CD8 ratio measured at ICU admission in COVID‐19 survivors and non‐survivors. B, ROC curves for CD4‐to‐CD8 ratio and neutrophil‐to‐CD8 ratio. C, Kaplan‐Meier analysis of CD4‐to‐CD8 ratio and neutrophil‐to‐CD8 ratio measured at the time of ICU admission. Thresholds were set to match the highest likelihood ratio. D, Correlation between CD4‐to‐CD8 ratio (green) or neutrophil‐to‐CD8 ratio (purple) and length of stay in ICU for survivors (left panel) and non‐survivors (right panel). Lines were drawn using linear regression. E, Correlation matrix between different measured parameters. The colour of each box indicates the Spearman r values. Symbols indicate the level of significance. # P < .1, *P < .05, **P < .01, ***P < .001. F, Plot of the Spearman correlation between the SOFA score and the CD4‐to‐CD8 ratio. The line was drawn using linear regression. Grey area indicates 95% confidence interval of the best fit line. P value indicates the F test result testing the null hypothesis of a zero‐slope line. Data in a were analysed by Mann‐Whitney test. Survival curves in c were compared with a Log‐rank Mantel‐Cox test. Correlations in D, E and F were calculated by a Spearman correlation test. Asterisks indicate the level of significance. *P < .05, **P < .01, ***P < .001
