
Figure 7.
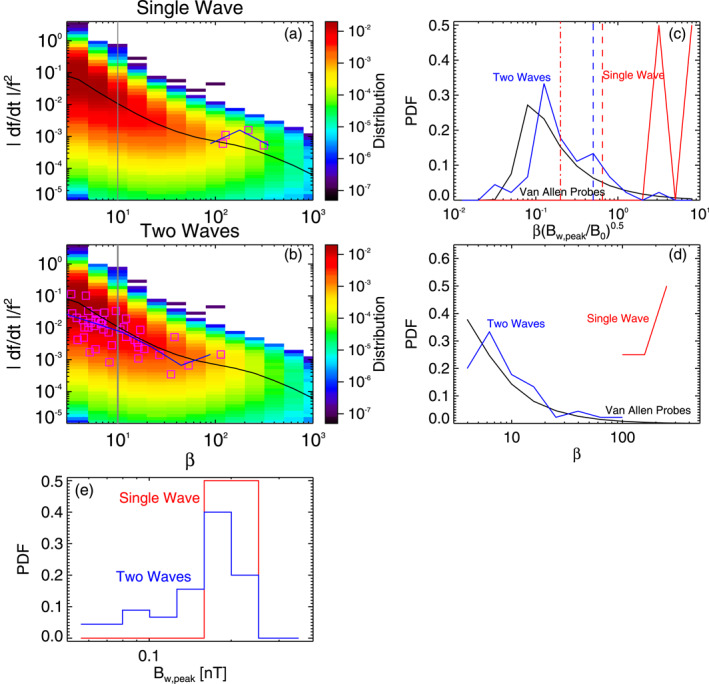
(a) Vlasov hybrid simulation (VHS) code results from the third simulation, with two triggering waves, during Single Wave intervals in Figure 6. Normalized frequency sweep rate |∂f/∂t|/f 2 of wave packets obtained in the simulation approximately 6,000 km away from the equator (magenta squares), as a function of packet length β (the median is shown by a blue curve). Corresponding statistical results from Van Allen Probes 2012–2018 observations are displayed in colors, with their median |∂f/∂t|/f 2 shown by a black curve. A gray line shows β = 10. (b) Same as (a) during Two Waves intervals. (c) Probability Distribution Function of wave packets as a function of obtained from Van Allen Probes statistical observations (black curve) and from the VHS code simulation during Single Wave intervals (red) and Two Waves intervals (blue). The minimum lengths β tr, min and β tr,min2 from Equations 2 and 3 of wave packets formed by nonlinear trapping‐induced wave amplitude modulation alone are shown by dashed‐dotted and dashed red vertical lines, respectively. The maximum length β ws, max from Equation 5 of packets formed by wave superposition alone is indicated by a dashed blue vertical line. (d) Probability distributions of wave packets from Van Allen Probes statistical observations (black) and from the VHS code simulation during Single Wave intervals (red) and Two Waves intervals (blue), as a function of packet length β. (e) Probability distributions of wave packets from the VHS code simulation during Single Wave intervals (red) and Two Waves intervals (blue), as a function of packet peak amplitude B w,peak .