Figure 8.

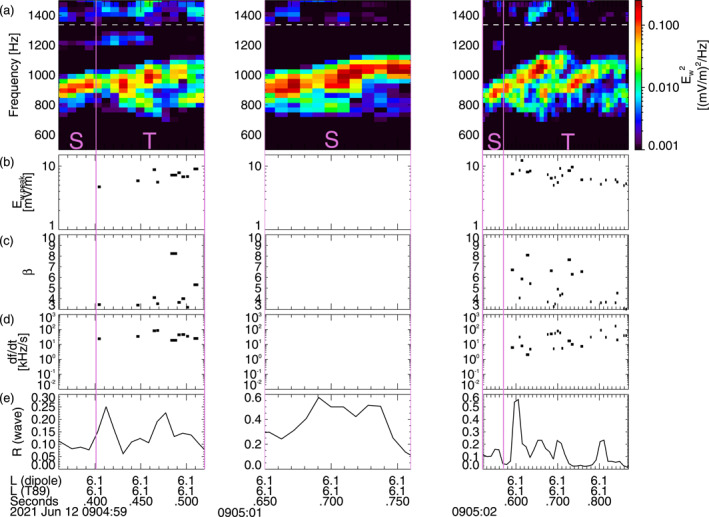
(a) Chorus wave Fast Fourier Transform (FFT) spectra from THEMIS E measurements on 12 June 2021 at L ≃ 6, approximately 1,000 km away from the magnetic equator. A white dashed line shows f ce /2. Intervals with only one single wave are marked by an S, intervals with two (or more) superposed waves are marked by a T, and these intervals are separated by vertical purple lines. (b) Peak amplitude of identified short packets, with a length β < 10. (c) Length β of short packets. (d) Frequency sweep rate ∂f/∂t of short packets. (e) Average parallel to transverse wave electric field power ratio R of lower‐band chorus waves. The L‐shell values inferred from dipolar and T89 (Tsyganenko, 1989) magnetic field models are also provided.
