
FIGURE 4.
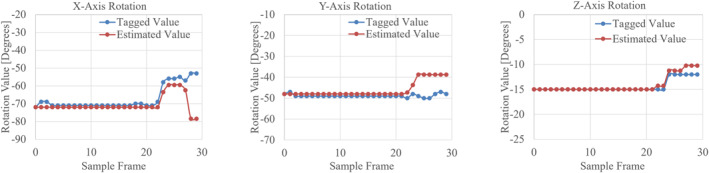
Trends representation of organ orientation on X, Y and Z axes comparing tagged (blue) and OF estimated (red) rotation values for each sample frame
Official websites use .gov
A
.gov website belongs to an official
government organization in the United States.
Secure .gov websites use HTTPS
A lock (
) or https:// means you've safely
connected to the .gov website. Share sensitive
information only on official, secure websites.
Trends representation of organ orientation on X, Y and Z axes comparing tagged (blue) and OF estimated (red) rotation values for each sample frame