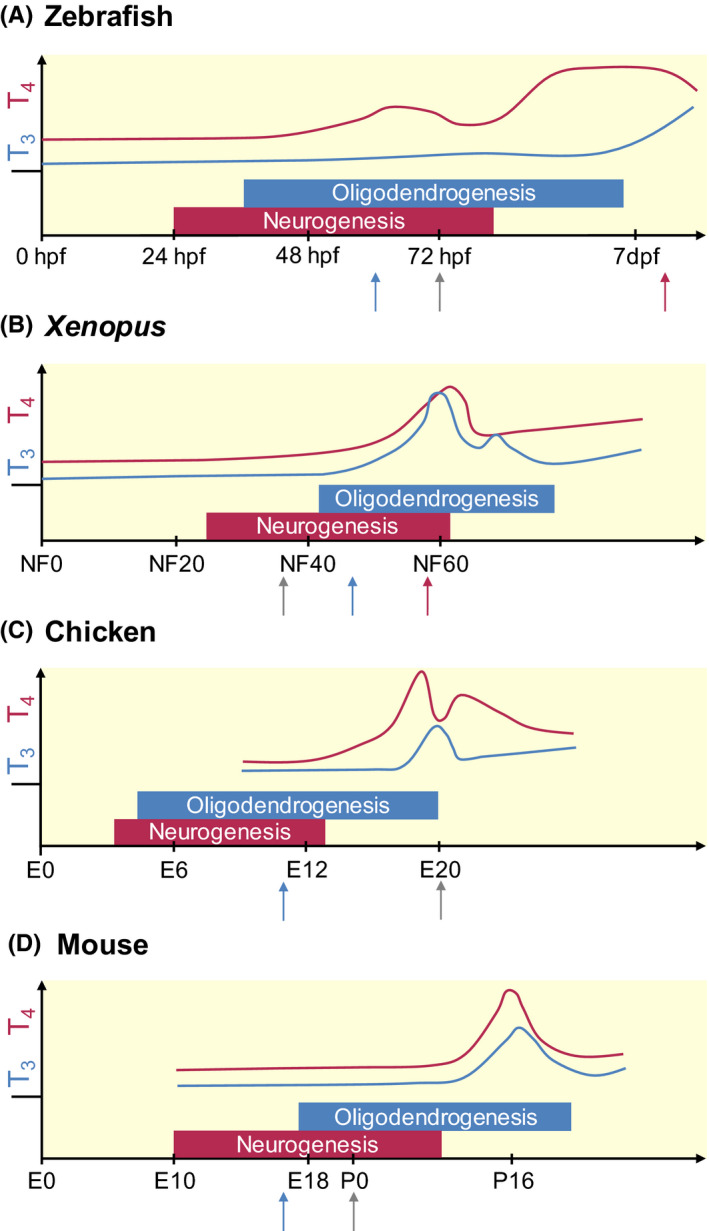
Figure 1.

Schematic representation of TH levels, and the timing of neurogenesis and oligodendrogenesis during the development of 4 classical vertebrate models. The x‐axis represents the relative time scale of development for each species, the y‐axis the relative concentrations of serum T4 (red line) and T3 (blue line) based on available data. The moment of hatching/birth is depicted by the grey arrow. Metamorphosis in fish (A) and amphibians (B) (red arrow) is characterized by a high TH peak. In contrast, the TH peak in chicken (C), a precocial bird, occurs at hatching, while a sharp TH peak is observed more than 2 weeks after birth in mice (D), a typical altricial species. For these, and possibly all vertebrates, the period of neurogenesis starts prior to that of oligodendrogenesis, although both phases overlap to some extent. The timing and regulation of these processes relies for a major part on maternal TH supply, prior to endogenous TH production by the foetal thyroid gland (tetrapods) or the thyroid follicles (fish) (blue arrow). While circulating TH levels are low in embryonic stages and generally reflect a high T4/T3 ratio, local regulators of T3 availability are expressed during these stages in all vertebrates, enabling temporal and cell‐specific control of TH action. dpf, days post fertilization; E, embryonic day; hpf, hours post fertilization; NF, Nieuwkoop‐Faber stage; P, postnatal day. T3: triiodothyronine, T4: tetraiodothyronine
