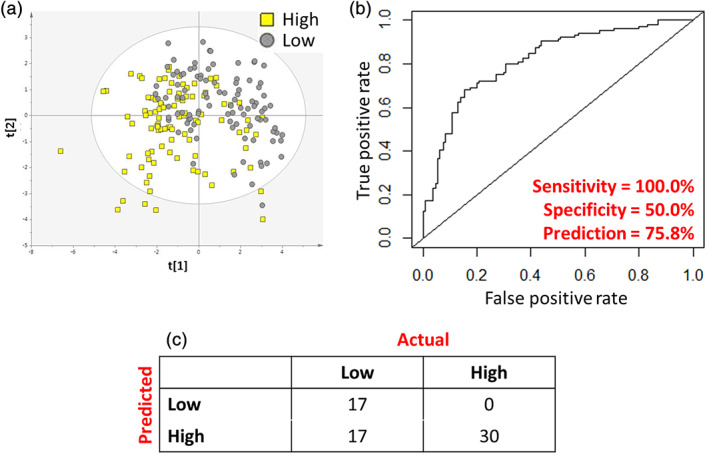
FIGURE 1.

Evaluation of the ability for 3 month metabolite profile to predict truncal:peripheral fat ratio at 2 years. (A) Scores plot of PLS‐DA model calculated on individuals with ‘high’ and ‘low’ truncal:peripheral fat ratio after the dataset had been stratified into three groups of ‘high’, ‘middle’ and ‘low’ truncal:peripheral fat ratio. (B) Receiver operating characteristic curve showing diagnostic ability of the model to identify individuals with high and low truncal: peripheral fat ratio. (C) Prediction matrix showing rates of correct classification
